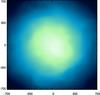
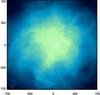
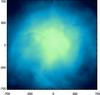
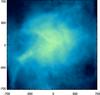
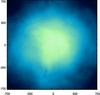
Fig. 4
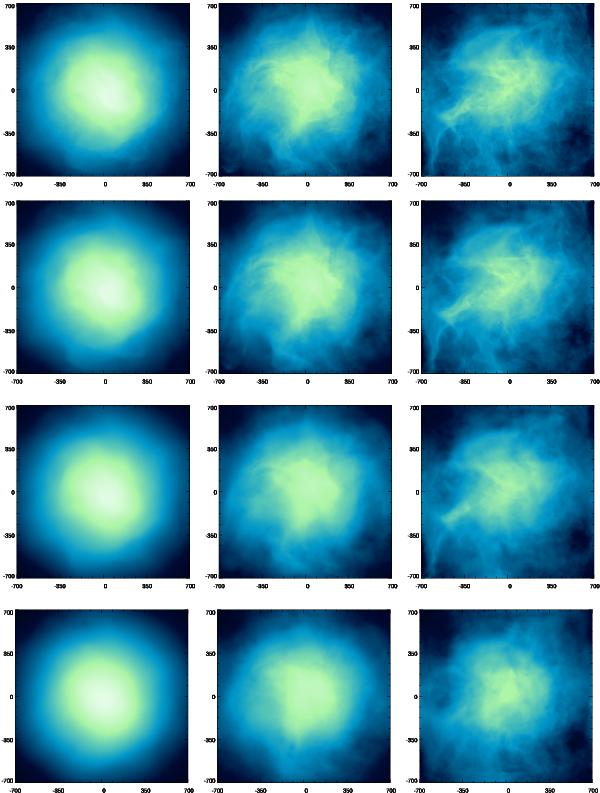
X-ray surface brightness for the models with weak (M ~ 0.25; left), mild (M ~ 0.5; middle), and strong turbulence (M ~ 0.75; right). From top to bottom: f = 0, 10-3, 10-2, 10-1 (f = 1 maps are similar to the latter images). The color coding is black − blue − pale green, in the range 10-7 − 4 × 10⁻⁵ erg s-1 cm-2. Conduction prevents the development of the full turbulent cascade, especially if f ≥ 0.1. K-H and R-T rolls and filaments are thus suppressed, and the cluster retains the spherical, smooth shape. Strong turbulence is instead able to deform the cluster, flattening the entropy profile and inducing a fainter (more rarefied) core. Perturbations are best observed at r > rc, or over the whole cluster if M > 0.5.


Current usage metrics show cumulative count of Article Views (full-text article views including HTML views, PDF and ePub downloads, according to the available data) and Abstracts Views on Vision4Press platform.
Data correspond to usage on the plateform after 2015. The current usage metrics is available 48-96 hours after online publication and is updated daily on week days.
Initial download of the metrics may take a while.