| Issue |
A&A
Volume 559, November 2013
|
|
|---|---|---|
| Article Number | A52 | |
| Number of page(s) | 6 | |
| Section | Interstellar and circumstellar matter | |
| DOI | https://doi.org/10.1051/0004-6361/201322286 | |
| Published online | 11 November 2013 | |
Absence of hot gas within the Wolf-Rayet bubble around WR 16
Instituto de Astrofísica de Andalucía, IAA-CSIC, Glorieta de la Astronomía s/n, 18008 Granada, Spain
e-mail: toala@iaa.es
Received: 15 July 2013
Accepted: 9 September 2013
We present the analysis of XMM-Newton archival observations towards the Wolf-Rayet (WR) bubble around WR 16. Despite the closed bubble morphology of this WR nebula, the XMM-Newton observations show no evidence of diffuse emission in its interior as in the similar WR bubbles NGC 6888 and S 308. We use the present observations to estimate a 3-σ upper limit to the X-ray luminosity in the 0.3–1.5 keV energy band equal to 7.4 × 1032 erg s-1 for the diffuse emission from the WR nebula, assuming a distance of 2.37 kpc. The WR nebula around WR 16 is the fourth observed by the current generation of X-ray satellites and the second not detected. We also examine FUSE spectra to search for nebular O vi absorption lines in the stellar continuum of WR 16. The present far-UV data and the lack of measurements of the dynamics of the optical WR bubble do not allow us to confirm the existence of a conductive layer of gas at T ~ 3 × 10⁵ K between the cold nebular gas and the hot gas in its interior. The present observations result in an upper limit of ne < 0.6 cm-3 on the electron density of the X-ray emitting material within the nebula.
Key words: circumstellar matter / stars: massive / stars: Wolf-Rayet / ISM: bubbles / pulsars: individual: WR16
© ESO, 2013
1. Introduction
When massive stars reach the Wolf-Rayet (WR) stage in their late evolution, powerful stellar winds carve the circumstellar medium and produce WR nebulae. X-ray emission from these objects is expected to arise from shock-heated plasma that is produced when the WR stellar wind rams into material previously ejected during the red supergiant (RSG) or luminous blue variable (LBV) phase (García-Segura & Mac Low 1995). To date, there are only three WR nebulae reported in the literature that had been observed with the latest generation of X-ray satellites (Chandra, Suzaku, and XMM-Newton): S 308, RCW 58, and NGC 6888 around WR 6, WR 40, and WR 136, respectively (Chu et al. 2003, 2006; Gosset et al. 2005; Zhekov & Park 2011; Toalá et al. 2012).
The most recent observations towards S 308 and NGC 6888 show a dominant X-ray-emitting plasma component with a temperature ≳106 K and abundances similar to those of the optical nebulae (Zhekov & Park 2011; Toalá et al. 2012). The temperature and abundances of the dominant X-ray-emitting plasma can be explained by means of mixing between the outer cold material and the shocked fast stellar wind. On the other hand, RCW 58 has not been detected by XMM-Newton (Gosset et al. 2005). The cause of this non-detection of hot gas may be twofold. First, WR nebulae lay within the Galactic plane, and their soft X-ray emission may be highly affected by absorption (RCW 58 has a Galactic latitude ~5°, and the hydrogen column towards it is 5 × 1021 cm-2). Secondly, RCW 58 presents a disrupted shell morphology (Gruendl et al. 2000), which can imply that the hot gas has already escaped outside the nebula, greatly reducing the X-ray emissivity (Toalá & Arthur 2011). The limited number of X-ray observations of WR nebulae makes it still an exploration field. It is thus highly important to increase the number of observed WR nebulae with good spatial coverage, high sensitivity, and suitable energy resolution for spectral analyses.
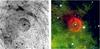 |
Fig. 1 Left: narrow-band Hα image of the WR nebula around WR 16 taken from the Super COSMOS Sky Survey (Parker et al. 2005). Right: color-composite mid-infrared WISE W2 4.6 μm (blue), W3 12 μm (green), and W4 22 μm (red) picture of the WR nebula around WR 16. The central star, WR 16, is located at the center of each image. North is up, east to the left. |
The soft nature of the X-ray emission detected in S 308 and NGC 6888 needs further discussion. Theoretical models of adiabatic shocked winds predict high plasma temperatures, >107 K (e.g., Dyson & Williams 1997), which are not reported by observations. The relatively low temperature of the X-ray-emitting plasma is often attributed to mixing in the wind-wind interaction zone, such as thermal conduction. The hot gas will be cooled down to temperatures of 106 K when in contact with the outer cold (~104 K) RSG or LBV material. As a result, a so-called conductive layer with intermediate temperatures, ~105 K, is created between the hot and cool gas, as has been first suggested by Castor et al. (1975) and Weaver et al. (1977) in wind-blown bubbles. Observationally, the conductive layer can be revealed by the presence of highly ionized species (Castor et al. 1975; Weaver et al. 1977). Indeed, this conductive layer has been detected in other wind-blown bubbles, such as those of planetary nebulae (PNe; Ruiz et al. 2013) using far-UV FUSE observations of the O vi doublet. At least in PNe, the conductive layer at ~105 K coexists with diffuse hot gas at X-ray-emitting temperatures ≳106 K (Gruendl et al. 2004).
The WR nebula around WR 16 was first discovered by Marston et al. (1994), who described it as a round main nebula with multiple arc-like features towards the northwest (see Fig. 1, left). The main nebula is classified as a wind-blown bubble (a W-type nebula according to the classification scheme developed by Chu 1981), whereas the outer features have been associated with multiple mass ejection episodes (Marston 1995). The rim of the main nebula is sharper towards the northwest direction. The diminished optical emission towards the southeast may be associated with extinction due to the molecular material along that direction that is revealed by radio observations (Marston et al. 1999; Duronea et al. 2013). Alternatively, this morphology may have resulted from the large proper motion of the central star along this direction (Duronea et al. 2013).
The optical and radio morphologies of the nebula around WR 16 are consistent with the mid-infrared morphology revealed by WISE observations (see Fig. 1, right). In particular, the W4 band (red in Fig. 1, right) shows a complete round shell with enhanced, limb-brightened emission towards the northwest direction. The round WR nebula seen in this WISE band matches that of the IRAS 60 μm image presented by Marston et al. (1999).
According to Toalá & Arthur (2011), the closed nebular shell and limb-brightened morphology of a WR nebula make it a promising candidate for its detection in X-rays, since a complete WR nebula is able to confine the highly pressurized X-ray-emitting gas, as is the case for S 308 and NGC 6888. Such hot gas can be expected to be in contact with the cold nebular shell throughout a conductive layer. In this paper, we have searched for the different components of hot gas in the WR bubble around WR 16 using archival XMM-Newton and FUSE observations towards this WR bubble. Section 2 describes the observations and data processing, whereas we briefly describe our findings in Sect. 3. We discuss our results in Sect. 4, and finally we summarize them in Sect. 5.
2. Observations
2.1. XMM-Newton observations
The XMM-Newton observations of the nebula around WR 16 were performed on 2009 Dec. 28–29 (Obs. ID 0602020301; PI: S. Skinner) during revolution 1841. The observations were obtained in the framework of a survey to study single nitrogen-rich stars to determine their X-ray properties and to characterize the emission processes. The data have been presented by Skinner et al. (2012), who focused on the analysis of the X-ray emission from the central star, WR 16. No further analysis of the potential diffuse X-ray emission was performed, and thus we will concentrate in the search and analysis of extended emission.
The two EPIC-MOS and pn cameras were operated in the full-frame mode for a total exposure time of 33 and 30 ks, respectively. The medium optical blocking filter was used. The observations were processed using the XMM-Newton Science Analysis Software (SAS Ver. 12.0.1) and the XMM-ESAS tasks for the analysis of the X-ray emission of extended objects and diffuse background (Snowden & Kuntz 2011), as required for the analysis of XMM-Newton observations of WR nebulae (Toalá et al. 2012). The associated current calibration files (CCF) available on June 2013, as obtained fromftp://xmm.esac.esa.int/pub/ccf/constituents/extras/esas_caldb, have been used to remove the contribution from the astrophysical background, soft proton background, and solar wind charge-exchange reactions with contributions at low energies (<1.5 keV).
The net exposure times after processing the data are 27.5, 28.9, and 14 ks for the EPIC/MOS1, MOS2, and pn cameras, respectively. We extracted images in four energy bands, namely 0.3–1.15 keV (soft), 1.15–2.5 keV (medium), 2.5–10 keV (hard), and 0.3–10 keV (total). The combined EPIC X-ray image in the total energy band is shown in Fig. 2 (left). Smoothed exposure-corrected images of the soft, medium, and hard images were created using the ESAS task adapt-900 requesting 20 counts of the original image for each smoothed pixel, and these were combined to create the false-color picture shown in Fig. 2 (right).
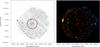 |
Fig. 2 Left: XMM-Newton EPIC (MOS1, MOS2, and pn) X-ray image of the field of view of WR 16 for the total energy range 0.3–10 keV. Right: XMM-Newton EPIC smoothed exposure-corrected, color-composite X-ray picture of WR 16, where the red color corresponds to the soft 0.3–1.15 keV energy band, green to the medium 1.15–2.5 keV band, and blue to the hard 2.5–10 keV band. The small red circle in both images shows the location of the central star, WR 16, whereas the dashed-line circle in the left image encompasses the optical WR nebula. |
2.2. FUSE observations
To complement the X-ray observations towards the WR bubble around WR 16, we have searched Far Ultraviolet Spectroscopic Explorer (FUSE) observations on the Mikulski Archive for Space Telescopes (MAST) of WR 16. The FUSE observations have a spectral coverage between 920–1190 Å with spectral resolution of R ~ 20 000 (Moos et al. 2000; Sahnow et al. 2000). Two sets of observations were used to create a far-UV spectrum of WR 16, namely Obs. ID G9271501 (start time 2006-07-10 05:18:34; exposure time 30.6 ks) and G9271502 (start time 2006-07-11 12:34:37; exposure time 30.7 ks). The data were reprocessed with the CalFUSE calibration pipeline software package, CalFUSE 3.2.3 (Dixon et al. 2007).
The resultant spectrum will be used to analyze the O vi λλ1032,1037 doublet. The presence of these lines may imply a conductive layer of gas at T ~ 3 × 10⁵ K between the outer cold (104 K) nebular material and the interior hot content, as in the case of star forming regions (e.g. Pathak et al. 2011) and PNe (Ruiz et al. 2013). The O vi lines are registered by the LiF2B (979–1075 Å), and SiC2B (1016–1103 Å) telescopes, gratings, and detector segments combinations. After processing, the observation ID G9271501 has net exposure times of 28.4 ks for LiF1A and 30.5 ks for LiF2B, whereas the observation ID G9271502 has net exposure times of 25.2 ks for LiF1A, 26.5 ks for LiF2B, and 7.2 ks for SiC1A. For both observations, the quality of the spectrum registered by SiC2B was limited and the resulting spectrum was not used. Details of the data processing and merging are similar as those described by Guerrero & De Marco (2013).
Figure 3 shows the final spectrum obtained from the FUSE observations. The O vi doublet lines are marked at 1031.93 Å and 1037.62 Å. Additional absorption lines from material in the interstellar medium and Earth atmosphere are also shown. Details and discussion on this spectrum will be presented in the following section.
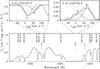 |
Fig. 3 FUSE far-UV spectrum towards WR 16. The bottom panel shows the spectral range around the O vi lines. Vertical solid lines mark the position of the O vi doublet and O i atomic line, whereas dotted lines mark the position of H2 absorption lines. The upper panels show enlargements of the O vi lines in the LSR velocity frame with multiple Gaussian fits to their profiles, which include components A and B as described in the text. |
3. Results
A preliminary inspection of the images presented in Fig. 2 does not reveal any diffuse X-ray emission within the nebula around WR 16, although a significant number of point sources are detected in the field of view of the EPIC cameras. Even though there is no detection of diffuse X-ray emission within this WR bubble, we can estimate an upper limit from the present observations. To derive this upper limit, we have extracted background-subtracted spectra from the three EPIC instruments corresponding to the source region shown in Fig. 2 (left), which encloses the optical nebula with a radius of 4 3. Point sources were carefully excised from either the source and background regions. The spectral analysis allowed us to derive 3-σ upper limits to the EPIC-pn, EPIC-MOS1, and EPIC-MOS2 count rates in the 0.3–1.5 keV energy range <28 counts ks-1, <14 counts ks-1, and <13 counts ks-1, respectively.
The X-ray flux and luminosity upper limits for the WR 16 nebula can be estimated from the count rates given above using the count rate simulator WebPIMMS (version 4.6)1. To derive these values, we have adopted an optically-thin APEC plasma emission model absorbed by a column density of 4.1 × 1021 cm-2, as implied by Bohlin et al.’s (1978) relation for an optical extinction AV of 2.14 mag where the average of the values is given by van der Hucht (2001). Furthermore, the temperature of the X-ray-emitting gas in the nebula has been assumed to be ~1.4 × 10⁶ K (kT ~ 0.122 keV), i.e., an intermediate value between those reported for the hot gas detected in S 308 and NGC 6888. Accounting for the use of the EPIC-pn camera with the medium filter, the resultant 3-σ upper limit for the absorbed flux in the 0.3–1.5 keV energy band is fX ≲ 3.1 × 10⁻¹⁴ erg cm-2 s-1 for an intrinsic flux of FX ≲ 1.1 × 10⁻¹² erg cm-2 s-1. The corresponding upper limit for the X-ray luminosity is LX ≲ 7.4 × 1032 erg s-1 for a distance of d = 2.37 kpc (van der Hucht 2001).
Using the normalization factor2 given by WebPIMMS, A = 1.38 × 10⁻³ cm-5, we can estimate an upper limit to the electron density of the hot gas in the nebula. This gives ne < 0.6 cm-3.
The FUSE spectrum shows a strong absorption feature at the wavelength of the O viλ1031.93 Å line and one weak emission feature at the wavelength of the O viλ1037.62 Å. These are indicative of the presence of hot gas at ~3 × 10⁵ K along the line of sight of WR 16. The detection of one component of the O vi doublet in absorption and the other in emission is certainly puzzling, as the physical conditions for emission and absorption are very different: O vi emission is typically ascribed to narrow, high-density interfaces in the local interstellar medium (Dixon & Sankrit 2008), whereas O vi absorptions can also be produced in large volumes of low-density hot gas. The two lines have been reported to be detected either in emission or absorption in surveys of the Galaxy and Magellanic Clouds (e.g., Howk et al. 2002), but the simultaneous detection of one component in absorption and the other in emission requires singular observational conditions. This may be the case of WR 16, as the stellar continuum around the O viλ1037.62 Å line is completely saturated, whereas it is not around the O vi λ1031.93 Å component. The particular shape of the stellar continuum of WR 16 makes the O viλ1037.62 Å component sensitive to emission from material along the line of sight but insensitively to absorption. On the other hand, the O vi λ1031.93 Å component is sensitive both to emissions and absorptions along the line of sight, but the former dominates the profile of this line, as the absorption component is stronger than the emission.
The profile shape of the O vi lines is not symmetric, implying different velocity components. We find that the most simple fit of both the emission and absorption spectral features involves two Gaussian components with VLSR ≃ 16 km s-1 and 60 km s-1, which are marked as component A and B in the top panels of Fig. 3, respectively. Component A has the same radial velocity as the H2 and O i absorption lines overimposed in the spectrum of WR 16, which are visible at the bottom panel of Fig. 3. Following the measurement of equivalent widths and column densities technique of O vi (Savage & Sembach 1991), we have computed the column density of the O viλ1031.93 Å line, NOVI (in cm-2), along the line of sight of WR 16. This technique uses the apparent optical depth in terms of velocity, ![\begin{equation} \tau(v) = \ln[I_{\mathrm{o}}(v)/ I_{\mathrm{obs}}(v)], \end{equation}](/articles/aa/full_html/2013/11/aa22286-13/aa22286-13-eq41.png) (1)where Io(v) and Iobs(v) are the continuum intensity and absorption line depth, respectively. The parameter NOVI can be calculated as
(1)where Io(v) and Iobs(v) are the continuum intensity and absorption line depth, respectively. The parameter NOVI can be calculated as 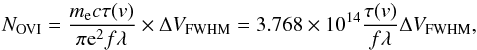 (2)where λ is the wavelength in Å and f is the oscillator strength of the atomic species (for O vi, f = 0.1325; see Pathak et al. 2011, for details). The parameters c, me, and e are the speed of light, and electron mass, and charge, respectively, where ΔVFWHM is the full width at half maximum of the line in km s-1. The O vi column density is estimated to be 1.4 × 1014 cm-2, which is consistent with the averaged value expected for a star at 2.37 kpc (NOVI ≲ 1014 cm-2; de Avillez & Breitschwerdt 2012). This is especially true if we consider the large spatial variations revealed by studies of the O vi content in the local interstellar medium along the line of sight of B-stars (Welsh & Lallement 2008) and hot DA white dwarfs (Barstow et al. 2010). Therefore, we can conclude that component A is due to the interstellar medium along the line of sight of WR 16.
Stellar and nebular parameters for the WR nebulae observed with modern X-ray satellites.
Component B of the O vi doublet, on the other hand, does not have a molecular or neutral interstellar medium counterpart. The intensity of its absorption in the λ1031.93 Å line implies a column density of 4.5 × 1013 cm-2, which is, about one third that of component A. The conductive layer within the nebula would result in a narrow O vi absorption feature bluewards of the systemic velocity of the WR 16 nebula. There are, however, no measurements of the dynamics (radial velocity and expansion) of the optical main WR bubble around WR 16 to carry out such comparison. Duronea et al. (2013) attributed a molecular component at VLSR ≃ − 9 km s-1 to the main nebular shell around WR 16. If this were indeed the case, then component B could not be ascribed to hot gas inside the WR nebula around WR 16 as its velocity would be redwards of the systemic velocity. We should then conclude that component B is most likely associated with a high excitation component of the interstellar medium along the line of sight towards WR 16.
4. Discussion
The WR nebulae can be expected to be filled with hot diffuse gas, as the current WR wind slams the slow and dense, previously ejected RSG or LBV material, which creates a shock wave that thermalizes the interior of the WR nebula. The star WR 16 possesses a stellar wind with terminal velocity, v∞, of 630 km s-1 (van der Hucht 2001), which would imply a shocked gas temperature ~1.2 × 10⁷ K (for a mean free particle μ ~ 1.3; van der Hucht et al. 1986). Higher velocities would imply even higher plasma temperatures, but S 308 and NGC 6888 possess plasma with temperatures barely greater than 106 K, which contrasts the terminal wind velocities, ≳1700 km s-1, of their central stars. This discrepancy is also seen in Hii regions and PNe, in which thermal conduction is invoked to explain the low observed plasma temperatures of the shocked stellar wind (Chu 2008).
The XMM-Newton observations described here show that no extended X-ray emission is detected inside the main nebular shell of WR 16, despite the sensitive integration time of these observations. To put this non-detection in context with previous observations of WR nebulae, we show the stellar and nebular parameters (distance, spectral type of the WR star, stellar wind velocity, nebular radius, observed X-ray surface brightness, and luminosity) for the four WR nebulae observed to date in Table 1 by the present generations of X-ray satellites, namely S 308, NGC 6888, RCW 58, and that around WR 16. The surface brightness and luminosity of RCW 58 in the 0.3–1.5 keV energy range have been computed from the count rate reported by Gosset et al. (2005) for a distance of 2.26 kpc (van der Hucht 2001) after adopting the same plasma temperature as for the WR nebula around WR 16. The observed surface brightness presented in Table 1, which is obtained by dividing the observed X-ray flux by the area sustained by the nebula, provides a distance independent measurement of the relative X-ray brightness of each nebula. We remark that the X-ray surface brightness and luminosity for RCW 58 and the WR nebula around WR 16 given in this table correspond to upper limits.
We first note that the distances to all WR nebulae in Table 1 are not dramatically different, ranging from 1.26 kpc up to 2.37 kpc. Furthermore, they are all absorbed by similar hydrogen column densities in the range 6 × 10²⁰–5 × 1021 cm-2. This situation suggests that the detection of extended X-ray emission from these sources does not depend on external factors, such as distance or amount of intervening material but rather points that the nebula around WR 16 is intrinsically fainter than S 308 and NGC 6888 with a surface brightness 6–20 times lower.
In sharp contrast, the stellar properties (spectral type and terminal wind velocity) seem to be correlated with the detectability of extended X-ray emission within these WR nebulae. Both S 308 and NGC 6888 harbor early WN4 and WN6 stars, respectively, with terminal wind velocities ≳1700 km s-1. Meanwhile, the non-detected WR nebulae in the X-rays have late WN stars, WN8h, with stellar velocities below 900 km s-1.
The nebular morphology has been claimed in the past to be correlated with X-ray emission: diffuse X-ray emission is present in S 308 and NGC 6888, and possess undisrupted morphologies, whereas RCW 58, which is undetected in X-rays, has a disrupted morphology (Gruendl et al. 2000). The interpretation of this behaviour is that a disrupted shell cannot hold the hot gas which escapes away. Contrary to this trend, the nebula around WR 16 displays a complete shell morphology (Fig. 1), but we have set a stringent upper limit for the X-ray emission from hot plasma in its interior.
The lack of X-ray emission motivated us to investigate the FUSE spectrum of WR 16, to search for spectral features in the O vi lines that could be attributed to gas at temperatures of ~3 × 10⁵ K (Fig. 3). Although several O vi absorption and emission components are detected in the FUSE spectrum of WR 16, none of them can be unambiguously attributed to a conductive layer in its nebula. This seems to suggest that this bubble has not experienced the effects of thermal conduction or any other equivalent physical processes (e.g., hydrodynamic ablation, photoevaporation; Arthur 2007; Pittard 2007) in the wind-wind interaction zone. As a result, the shocked wind material may still possess temperatures of 1.2 × 10⁷ K but extremely low densities in the range 0.001–0.01 cm-3. If this were to be the case, the non-detection of X-ray emission from the WR bubble around WR 16 does not automatically imply the lack of interior hot gas, but its low density has reduced its differential emission measure below the detectability limits.
5. Summary and conclusions
We present the analysis of XMM-Newton archival observations of the WR nebula around WR 16. These observations show that there is no detection of hot gas within the nebula, but a number of point sources are detected in the field of view. An upper limit to the unabsorbed flux in the 0.3–1.5 keV band has been estimated to be FX ≲ 1.1 × 10⁻¹² erg s-1 cm-2, which corresponds to a luminosity LX ≲ 7.4 × 1032 erg s-1 at a distance of 2.37 kpc and an upper limit to the electron density of ne < 0.6 cm-3.
Following the hypothesis that thermal conduction takes place between the outer cold (104 K) nebular gas and the hot interior of the WR nebula, we have searched for a conductive layer between these two components using FUSE observations of the O vi doublet. We find that both lines can be modelled as the contribution of two components at VLSR = 16 km s-1 and VLSR = 60 km s-1, respectively. The velocity of the first component is coincident with that of H2 and low-excitation ions and neutral atoms in the interstellar medium along the line of sight towards WR 16. Its column density is also consistent with the amount of intervening material expected for a star at the distance of WR 16. The second component does not have a counterpart in the low-excitation interstellar medium, but its radial velocity is not consistent with that expected for the expanding nebular shell of WR 16 from radio molecular observations. Unless there is a significant revision of the radial velocity of WR 16, the present observations suggest that this second component can neither be associated with a conductive layer.
The lack of detection of hot gas (105–107 K) within the WR bubble around WR 16 is puzzling. This nebula is one of the four WR nebulae observed with the latest generation of X-ray satellites, and is the second non-detected. Because the low number statistics, it is important to increase the number of X-ray observations towards these nebulae with better spatial coverage, sensitivity, and energy resolution to define the stellar and nebular properties required for the presence of hot gas in these objects.
Acknowledgments
We would like to thank the anonymous referee for her/his valuable comments, which improved the presentation of this paper. Part of the data presented in this paper were obtained from the Mikulski Archive for Space Telescopes (MAST). STScI is operated by the Association of Universities for Research in Astronomy, Inc., under NASA contract NAS5-26555. Support for MAST for non-HST data is provided by the NASA Office of Space Science via grant NNX09AF08G and by other grants and contracts. This work is funded by the Spanish MICINN (Ministerio de Ciencia e Innovación) grant AYA 2011-29754-C03-02 co-funded with FEDER funds. J.A.T. acknowledges support by the CSIC JAE-Pre student grant 2011-00189.
References
- Arthur, S. J. 2007, in Diffuse Matter from Star Forming Regions to Active Galaxies, eds. T. W. Hartquist, J. M. Pittard, & S. A. E. G. Falle, Ap&SS Proc. (Dordrecht: Springer), 183 [Google Scholar]
- Barstow, M. A., Boyce, D. D., Welsh, B. Y., et al. 2010, ApJ, 723, 1762 [NASA ADS] [CrossRef] [Google Scholar]
- Bohlin, R. C., Savage, B. D., & Drake, J. F. 1978, ApJ, 224, 132 [NASA ADS] [CrossRef] [Google Scholar]
- Castor, J., McCray, R., & Weaver, R. 1975, ApJ, 200, L107 [NASA ADS] [CrossRef] [Google Scholar]
- Chu, Y.-H. 1981, ApJ, 249, 195 [NASA ADS] [CrossRef] [Google Scholar]
- Chu, Y.-H. 2008, IAU Symp. Proc., 250, 341 [Google Scholar]
- Chu, Y.-H., Guerrero, M. A., Gruendl, R. A., García-Segura, G., & Wendker, H. J. 2003, ApJ, 599, 1189 [NASA ADS] [CrossRef] [Google Scholar]
- Chu, Y.-H., Gruendl, R. A., & Guerrero, M. A. 2006, in The X-ray Universe Proc., ESA-SP, 604, 363 [NASA ADS] [Google Scholar]
- de Avillez, M. A., & Breitschwerdt, D. 2012, ApJ, 761, L19 [NASA ADS] [CrossRef] [Google Scholar]
- Dixon, W. V. D., & Sankrit, R. 2008, ApJ, 686, 1162 [NASA ADS] [CrossRef] [Google Scholar]
- Dixon, W. V., Sahnow, D. J., Barrett, P. E., et al. 2007, PASP, 119, 527 [NASA ADS] [CrossRef] [Google Scholar]
- Duronea, N. U., Arnal, E. M., & Bronfman, L. 2013, A&A, 551, A71 [NASA ADS] [CrossRef] [EDP Sciences] [Google Scholar]
- Dyson, J. E., & Williams, D. A. 1997, The physics of the interstellar medium, 2nd edn. (Bristol: Institute of Physics Publishing) [Google Scholar]
- García-Segura, G., & Mac Low, M.-M. 1995, ApJ, 455, 145 [NASA ADS] [CrossRef] [Google Scholar]
- Gosset, E., Nazé, Y., Claeskens, J.-F., et al. 2005, A&A, 429, 685 [NASA ADS] [CrossRef] [EDP Sciences] [Google Scholar]
- Gruendl, R. A., Chu, Y.-H., Dunne, B. C., & Points, S. D. 2000, AJ, 120, 2670 [NASA ADS] [CrossRef] [Google Scholar]
- Gruendl, R. A., Chu, Y.-H., & Guerrero, M. A. 2004, ApJ, 617, L127 [NASA ADS] [CrossRef] [Google Scholar]
- Guerrero, M. A., & De Marco, O. 2013, A&A, 553, A126 [NASA ADS] [CrossRef] [EDP Sciences] [Google Scholar]
- Howk, J. C., Sembach, K. R., Savaga, B. D., et al. 2002, ApJ, 569, 214 [NASA ADS] [CrossRef] [Google Scholar]
- Marston, A. P. 1995, AJ, 109, 1839 [NASA ADS] [CrossRef] [Google Scholar]
- Marston, A. P., Yocum, D. R., García-Segura, G., & Chu, Y.-H. 1994, ApJS, 95, 151 [NASA ADS] [CrossRef] [Google Scholar]
- Marston, A. P., Welzmiller, J., Bransford, M. A., Black, J. H., & Bergman, P. 1999, ApJ, 518, 769 [NASA ADS] [CrossRef] [Google Scholar]
- Moos, H. W., Cash, W. C., Cowie, L. L., et al. 2000, ApJ, 538, L1 [NASA ADS] [CrossRef] [Google Scholar]
- Parker, Q. A., Phillipps, S., Pierce, M. J., et al. 2005, MNRAS, 362, 689 [NASA ADS] [CrossRef] [Google Scholar]
- Pathak, A., Pradhan, A. C., Sujatha, N. V., & Murthy, J. 2011, MNRAS, 412, 1105 [NASA ADS] [Google Scholar]
- Pittard, J. M. 2007, in Diffuse Matter from Star Forming Regions to Active Galaxies, eds. T. W. Hartquist, J. M. Pittard, & S. A. E. G. Falle, Ap&SS Proc. (Dordrecht: Springer), 245 [Google Scholar]
- Ruiz, N., Chu, Y.-H., Gruendl, R. A., et al. 2013, ApJ, 767, 35 [NASA ADS] [CrossRef] [Google Scholar]
- Sahnow, D. J., Moos, H. W., Ake, T. B., et al. 2000, ApJ, 538, L7 [NASA ADS] [CrossRef] [Google Scholar]
- Savage, B. D., & Sembach, K. R. 1991, ApJ, 379, 245 [NASA ADS] [CrossRef] [Google Scholar]
- Skinner, S. L., Zhekov, S. A., Güdel, M., Schmutz, W., & Sokal, K. R. 2012, AJ, 143, 116 [NASA ADS] [CrossRef] [Google Scholar]
- Snowden, S. L., & Kuntz, K. D. 2011, BAAS, 43, #344.17 [Google Scholar]
- Toalá, J. A., & Arthur, S. J. 2011, ApJ, 737, 100 [NASA ADS] [CrossRef] [Google Scholar]
- Toalá, J. A., Guerrero, M. A., Chu, Y.-H., et al. 2012, ApJ, 755, 77 [NASA ADS] [CrossRef] [Google Scholar]
- van der Hucht, K. A. 2001, New Astron. Rev., 45, 135 [NASA ADS] [CrossRef] [Google Scholar]
- van der Hucht, K. A., Cassinelli, J. P., & Williams, P. M. 1986, A&A, 168, 111 [NASA ADS] [Google Scholar]
- Weaver, R., McCray, R., Castor, J., Shapiro, P., & Moore, R. 1977, ApJ, 218, 377 [NASA ADS] [CrossRef] [Google Scholar]
- Welsh, B.Y., & Lallement, R. 2008, A&A, 490, 707 [NASA ADS] [CrossRef] [EDP Sciences] [Google Scholar]
- Zhekov, S. A., & Park, S. 2011, ApJ, 728, 135 [NASA ADS] [CrossRef] [Google Scholar]
All Tables
Stellar and nebular parameters for the WR nebulae observed with modern X-ray satellites.
All Figures
|
Fig. 1 Left: narrow-band Hα image of the WR nebula around WR 16 taken from the Super COSMOS Sky Survey (Parker et al. 2005). Right: color-composite mid-infrared WISE W2 4.6 μm (blue), W3 12 μm (green), and W4 22 μm (red) picture of the WR nebula around WR 16. The central star, WR 16, is located at the center of each image. North is up, east to the left. |
| In the text | |
|
Fig. 2 Left: XMM-Newton EPIC (MOS1, MOS2, and pn) X-ray image of the field of view of WR 16 for the total energy range 0.3–10 keV. Right: XMM-Newton EPIC smoothed exposure-corrected, color-composite X-ray picture of WR 16, where the red color corresponds to the soft 0.3–1.15 keV energy band, green to the medium 1.15–2.5 keV band, and blue to the hard 2.5–10 keV band. The small red circle in both images shows the location of the central star, WR 16, whereas the dashed-line circle in the left image encompasses the optical WR nebula. |
| In the text | |
|
Fig. 3 FUSE far-UV spectrum towards WR 16. The bottom panel shows the spectral range around the O vi lines. Vertical solid lines mark the position of the O vi doublet and O i atomic line, whereas dotted lines mark the position of H2 absorption lines. The upper panels show enlargements of the O vi lines in the LSR velocity frame with multiple Gaussian fits to their profiles, which include components A and B as described in the text. |
| In the text | |
Current usage metrics show cumulative count of Article Views (full-text article views including HTML views, PDF and ePub downloads, according to the available data) and Abstracts Views on Vision4Press platform.
Data correspond to usage on the plateform after 2015. The current usage metrics is available 48-96 hours after online publication and is updated daily on week days.
Initial download of the metrics may take a while.