Fig. 3
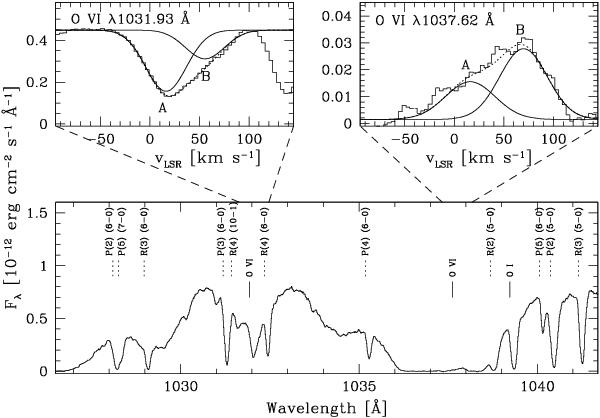
FUSE far-UV spectrum towards WR 16. The bottom panel shows the spectral range around the O vi lines. Vertical solid lines mark the position of the O vi doublet and O i atomic line, whereas dotted lines mark the position of H2 absorption lines. The upper panels show enlargements of the O vi lines in the LSR velocity frame with multiple Gaussian fits to their profiles, which include components A and B as described in the text.
Current usage metrics show cumulative count of Article Views (full-text article views including HTML views, PDF and ePub downloads, according to the available data) and Abstracts Views on Vision4Press platform.
Data correspond to usage on the plateform after 2015. The current usage metrics is available 48-96 hours after online publication and is updated daily on week days.
Initial download of the metrics may take a while.