Fig. 4
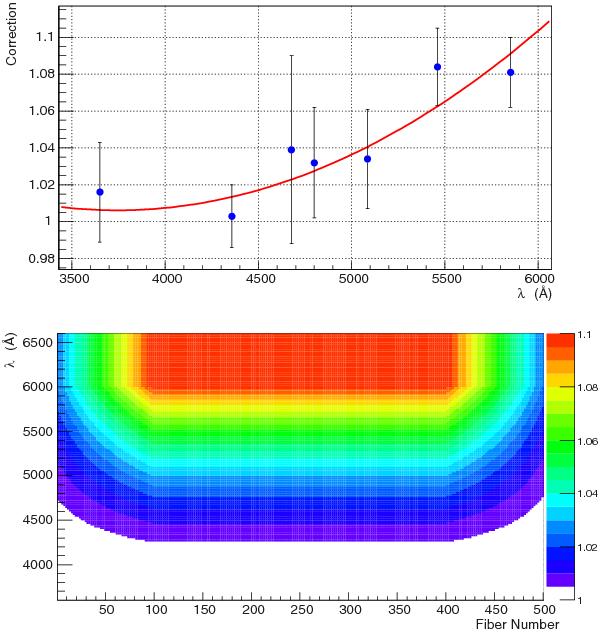
Top: correction of the pipeline resolution for spectra in the middle of the CCD (fiber numbers ~250). The curve is the best second-order polynomial fit to the measurements at the arc-lamp wavelengths. Bottom: 2D correction table of the pipeline resolution as a function of fiber number (ie. position of spectrum on CCD) and wavelength.
Current usage metrics show cumulative count of Article Views (full-text article views including HTML views, PDF and ePub downloads, according to the available data) and Abstracts Views on Vision4Press platform.
Data correspond to usage on the plateform after 2015. The current usage metrics is available 48-96 hours after online publication and is updated daily on week days.
Initial download of the metrics may take a while.