Fig. 24
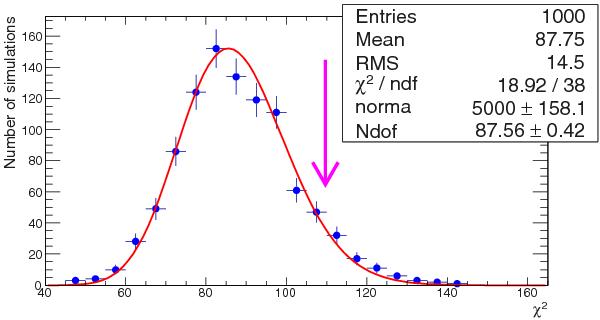
Distribution of the χ2 obtained for 1000 simulations reproducing the 1D power spectrum measured by BOSS. The mean of the distribution is 87.8 and a fit of the distribution following a χ2 law defined in Eq. (17) gives a number of degrees of freedom equal to 87.6 ± 0.4.
Current usage metrics show cumulative count of Article Views (full-text article views including HTML views, PDF and ePub downloads, according to the available data) and Abstracts Views on Vision4Press platform.
Data correspond to usage on the plateform after 2015. The current usage metrics is available 48-96 hours after online publication and is updated daily on week days.
Initial download of the metrics may take a while.