Fig. 19
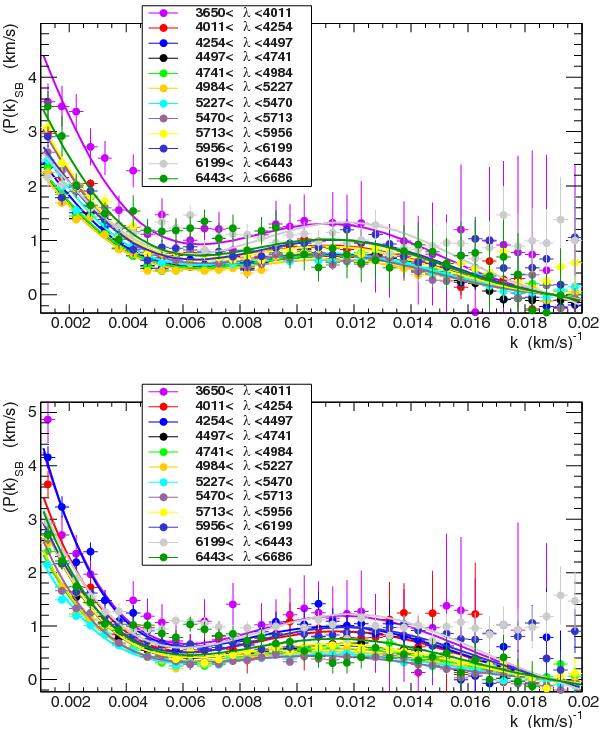
Power spectrum P(k) computed for sideband regions above the Lyα forest region for different λ windows. Each λ region corresponds to one redshift bin. The top and bottom plots correspond respectively to the two sidebands defined in the rest frame by 1270 < λRF < 1380 Å and 1410 < λRF < 1520 Å. Each power spectrum is fitted by the product of the sixth-degree polynomial obtained in Fig. 18 and a first-degree polynomial in which the 2 parameters are free.
Current usage metrics show cumulative count of Article Views (full-text article views including HTML views, PDF and ePub downloads, according to the available data) and Abstracts Views on Vision4Press platform.
Data correspond to usage on the plateform after 2015. The current usage metrics is available 48-96 hours after online publication and is updated daily on week days.
Initial download of the metrics may take a while.