Fig. 15
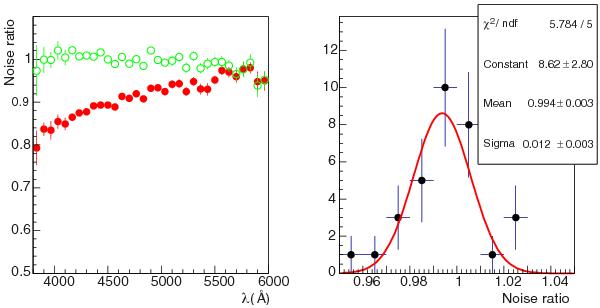
Left: ratio of pipeline to side-band estimates of the noise as a function of the wavelength without correction (red dots) and when including the correction of Eq. (2) (green circles). Right: distribution of the residuals of the noise ratio including noise correction; the rms of the green distribution, ~1.5%, gives an estimate of the uncertainty on the noise correction.
Current usage metrics show cumulative count of Article Views (full-text article views including HTML views, PDF and ePub downloads, according to the available data) and Abstracts Views on Vision4Press platform.
Data correspond to usage on the plateform after 2015. The current usage metrics is available 48-96 hours after online publication and is updated daily on week days.
Initial download of the metrics may take a while.