Fig. 1
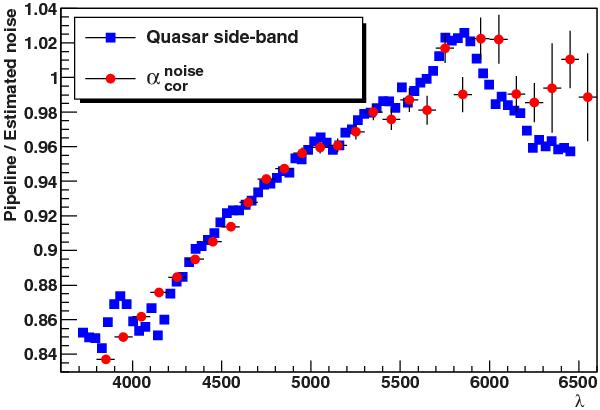
Ratio of the pipeline noise estimate to the actual flux dispersion in the spectra. The blue squares denote this ratio as estimated from the quasar 1330 < λRF < 1380 Å and 1450 < λRF < 1500 Å sidebands. The red points indicate the correction from our procedure (Eq. (2)) as a function of mean forest wavelength.
Current usage metrics show cumulative count of Article Views (full-text article views including HTML views, PDF and ePub downloads, according to the available data) and Abstracts Views on Vision4Press platform.
Data correspond to usage on the plateform after 2015. The current usage metrics is available 48-96 hours after online publication and is updated daily on week days.
Initial download of the metrics may take a while.