| Issue |
A&A
Volume 559, November 2013
|
|
|---|---|---|
| Article Number | A60 | |
| Number of page(s) | 5 | |
| Section | Interstellar and circumstellar matter | |
| DOI | https://doi.org/10.1051/0004-6361/201322102 | |
| Published online | 14 November 2013 | |
Scattering from dust in molecular clouds: Constraining the dust grain size distribution through near-infrared cloudshine and infrared coreshine
1
UJF – Grenoble 1/CNRS – INSU, Institut de Planétologie et d’Astrophysique
de Grenoble (IPAG), UMR 5274
38041
Grenoble
France
e-mail:
This email address is being protected from spambots. You need JavaScript enabled to view it.
2
LERMA, UMR 8112 du CNRS, Observatoire de Paris, 61, Av. de
l’Observatoire, 75014
Paris,
France
3
Infrared Processing and Analysis Center, California Institute of
Technology, Pasadena
CA
91125,
USA
Received: 18 June 2013
Accepted: 14 October 2013
Abstract
Context. The largest grains (0.5−1 μm) in the interstellar size distribution are efficient in scattering near- and mid-infrared radiation. These wavelengths are therefore particularly well suited to probe the still uncertain high-end of the size distribution.
Aims. We investigate the change in appearance of a typical low-mass molecular core from the Ks (2.2 μm) band to the Spitzer IRAC 3.6 and 8 micron bands, and compare with model calculations, which include variations of the grain size distribution.
Methods. We combine Spitzer IRAC and ground-based near-infrared observations to characterize the scattered light observed at the near- and mid-infrared wavelengths from the core L260. Using a spherical symmetric model core, we perform radiative transfer calculations to study the impact of various dust size distributions on the intensity profiles across the core.
Results. The observed scattered light patterns in the Ks and 3.6 μm bands are found to be similar. By comparison with radiative transfer models the two profiles place constraints on the relative abundance of small and large (more than 0.25 μm) dust grains. The scattered light profiles are found to be inconsistent with an interstellar silicate grain distribution extending only to 0.25 μm and large grains are needed to reach the observed fluxes and the flux ratios. The shape of the Ks band surface brightness profile limits the largest grains to 1−1.5 μm.
Conclusions. In addition to observing coreshine in the Spitzer IRAC channels, the combination with ground-based near-infrared observations are suited to constrain the properties of large grains in cores.
Key words: dust, extinction / ISM: clouds / stars: formation / scattering
© ESO, 2013
1. Introduction
Interstellar dust is a major constituent of the interstellar medium (ISM) and molecular cores. Moreover, the dust grains serve as building blocks for the planets to be formed in the later phases of the star formation process. For the diffuse ISM the dust distribution as a function of size, a, has been determined to be well approximated by a power-law, dn/da ∝ a-3.5 (Mathis et al. 1977, known as an MRN distribution) extending to a grain size of about 0.25 μm for silicate grains. Recently it was found that grains in low-mass molecular cores scatter mid-infrared (3.6−4.5 μm) light efficiently (Steinacker et al. 2010; Pagani et al. 2010), and it was coined coreshine to distinguish it from cloudshine, which is observed at shorter wavelengths from the outer parts of cores (Foster & Goodman 2006; Padoan et al. 2006; Juvela et al. 2006). A radiative transfer analysis based on a dust grain growth model coupled to the cloud density variation showed that it takes grains larger than typical 0.1 μm ISM grains to scatter mid-infrared radiation (Steinacker et al. 2010). This points towards grain growth already at an early stage of molecular cores. Grain growth is suggested by several coagulation models with varying efficiency based on the assumptions about turbulence and coagulation (e.g. Ossenkopf 1993; Weidenschilling & Ruzmaikina 1994; Ormel et al. 2009).
There have been independent claims of grain growth in molecular clouds through e.g. mid-infrared extinction measurements (e.g. Ascenso et al. 2013; Foster et al. 2013; Cambrésy et al. 2011) as well as far-infrared/mm thermal emission (e.g. Stepnik et al. 2003; Roy et al. 2013). Scattering provides an independent and complementary window to study the dust properties in molecular cores and in particular to probe the grain size distribution. Early work using only the near-infrared showed that indeed large grains would be necessary but the sizes for the larger grains were not determined (Lehtinen & Mattila 1996). Here we show the possibilities to constrain the grain size distribution through near- and mid-infrared observations by combining Spitzer IRAC data of one particular core, L260-SMM2 (hereafter L260) with archival J and Ks band data from the VISTA VSH survey. The surface brightness profiles are then compared with a radiative transfer model.
L260 is a low mass core in Ophiuchus North, situated out of the Galactic plane (l,b) = (8.6°, +22°). From mm continuum maps, Visser et al. (2002) estimated a total mass of 1 M⊙ for a distance of 160 pc. Caselli et al. (2002) suggest a virial mass of 3 M⊙ based on the width of the N2H+ line. Although there is a protostellar source west of the core (Class I, Lbol = 0.7 L⊙Bontemps et al. 1996), the core itself appears starless, without any 24 μm source and yet shows coreshine. The core is extended with a relatively low central density of some n0 = 2.2 × 104 cm-3. Line tracers indicate that the core has a very low level of turbulence. Caselli et al. (2002) found a N2H+ line width of 0.2 ± 0.02 km s-1, suggesting that the turbulence contribution to the total linewidth is similar to the thermal width. Visser et al. (2002) found no evidence for any outflow activity, which is supported by the narrow line widths. There is thus little evidence for any hidden protostar in the core, which would suggest that the core is relatively young.
The paper is outlined as follows. In Sect. 2 we discuss the available data from Spitzer and the VISTA VSH survey. In Sect. 3 we present the immediate results from the surface brightness profiles in the different wavelength bands along a cut through the core. Section 4 discusses intensity profiles obtained from a simple core model with varying dust size distribution. Finally we summarize our findings in Sect. 5.
2. Data
2.1. Spitzer data
We have utilized the list of cores compiled in Pagani et al. (2010) and identified L260 as a case where the coreshine is evident relative to the background and the confusion from field stars is relatively low. The core has been observed with Spitzer as part of the C2D programme (Evans et al. 2003) and later during the warm phase of the mission within the programme “Hunting Coreshine with Spitzer” (PI Paladini). The longer wavelength data (8 μm, IRAC4) are obtained from the cold mission while we utilize the 3.6 μm (IRAC1) data from the warm mission due to longer integration time and hence better signal to noise.
We use the recently calibrated data from the archive for the IRAC observations. The long wavelength data were obtained with an exposure time of 12 s per frame and 2 frames per position in the mosaic. The integration time per pixel is 10.4 s and thus the total integration time per pixel is 20.8 s. The IRAC1 data were obtained with an exposure time of 30 s per position. The coverage for almost all the mosaic was 6 frames or more. The integration time per pixel is 23.6 s and the total integration time per pixel is thus 141.6 s, more in the overlap regions.
2.2. Near-infrared data
L260 was observed on August 30, 2010 as part of the ESO VISTA VSH survey (PI McMahon) through the filters J and Ks. The on-source integration time is 15 s per dither and 2 dithers were obtained on source. Concatenated frames were obtained as part of the survey with offsets substantially larger than the size of L260. We have utilized the pipeline reduced data where the observations in each filter have been flat fielded, sky subtracted and co-added. There is no evidence for any extended emission in either the J or Ks bands that is not directly related to L260. The data are calibrated to the 2MASS system. Zero point calibration was performed for both filters adopting stars in common between the observed dataset and 2MASS. Finally, the data were re-binned to the same spatial resolution as the Spitzer data, i.e from 0.339′′ to 0.6′′.
 |
Fig. 1 Top to bottom from left to right: the J, Ks, IRAC1, and IRAC4 images of L260. The maps are centred on (RA, Dec) = (16:47:08.35, –09:35:13) and the figures are in equatorial coordinates. Marked in IRAC4 with two asterisks is the extent of the cuts shown in Fig. 2 and the arrow indicates the location of the protostar. The field of view of each image is 108 × 98. |
3. Observational results
Figure 1 shows the image of L260 in the J, Ks, IRAC1, and IRAC4 filters. The centre of the core is easily identified in IRAC4 where it shows up as an almost circular absorption feature. There is also indication that the core has an extension to the east of low column density, traced by a correspondingly low optical depth in the IRAC4 band.
To characterise the scattering from the core as a function of wavelength we have made a cut through the core at constant Galactic latitude. Although the cloudshine and coreshine can readily be seen in the images in the sense that the scattered light follows the extinction observed in IRAC4, it is still a relatively faint (some 20%) phenomenon relative to the background contribution in the images. To improve the signal to noise ratio we have therefore binned the pixels perpendicular to the cut direction. The average surface brightness over 10 pixels perpendicular to the direction of the cut (6′′, or 960 AU) is used. There is no apparent structure in either the cloudshine or coreshine on this scale. Further, the flux is smoothed over 5 pixels in the Galactic latitude direction. The random noise for the surface brightness profiles have been estimated from the variation of the pixel values for each average bin. For all the surface brightness profiles a linear fit has been performed to the background which has then been subtracted. The slope is small in both Spitzer wavelengths. However, at the J and Ks bands the slope is stronger. For the Ks band the change in background level across the core is 0.1 MJy/sr resulting in a systematic uncertainty on the peak of the surface brightness profile of ±0.05 MJyr/sr. For the IRAC1 band the change in the peak surface brightness is 0.01 MJy/sr.
The comparison of the surface brightness profiles shown in Fig. 2 illustrates the difference in morphology of the 3 scattering profiles. The IRAC1 profile is smooth, symmetric, and peaks close to the position with the highest column density as measured in the IRAC4 band. For the Ks band surface brightness profile a slight flattening is noticed but only very close to the centre of the core, as expected if the flattening is due to extinction effects. The J band is a bit more complicated. The profile peaks on the Galactic Centre side of the core and is substantially weaker on the other side due to self-absorption. This is due to absorption of the background radiation that is stronger in the J band than the scattering of the interstellar radiation field which results in parts of the core appearing in absorption. Further, the J band profile is complicated by low column density material. It is likely part of Ophiuchus north since the radial velocity is similar, based on molecular line measurements (Andersen et al., in prep.) but there is no evidence that it is directly associated with L260. We have chosen not to use it in the modelling. In more isolated cores the J band is likely to be a further diagnostic of the grain population.
The scattered light mainly originates from the interstellar radiation field. Protostars can emit substantial radiation at near-infrared and mid-infrared wavelengths due to their low temperature, large surface area, and the presence of circumstellar material. However, the morphology of the scattered light images does not show evidence for a very close by radiation source. Indeed, if the protostar located to the west of the core (marked by the arrow in Fig. 1) was strongly illuminating the core it would be difficult to obtain bright cloudshine, especially in the J band, to the east of the core centre which is what is observed. On the other hand, the cloudshine and coreshine seen just south of the protostar may have a local origin.
 |
Fig. 2 Surface brightness cuts through the core L260. The location of the cut is shown in panel 4 in Fig. 1. The cuts extend along constant Galactic latitude from the right hand side in Figure 1 towards the left between the points marked with asterisks. The bright spikes most notable in the IRAC1 profile are due to stars. |
4. Scattered light profiles of a model core with the properties of L260
So far, only L183 has been modelled with a detailed 3D structure and dust model to explain the coreshine in the Spitzer images (Steinacker et al. 2010). The dust model assumed a single grain size per location and a power-law relation between particle size and local gas density. While Steinacker et al. (2010) were able to fit the observed coreshine morphology, the flux gradients were larger in the model images than in the observed ones. Moreover, for optically thin scattering, the general good correlation between coreshine pattern and extinction pattern for many cores (Pagani et al. 2010) might indicate a better mixing of grain sizes throughout the core. Therefore, we test the case of a size distribution which is not varying across the core. To perform a series of radiative transfer calculations, we have modified parts of the radiative transfer code applied in Steinacker et al. (2010) to make use of opacities which are derived from an integration over the size distribution weighted properties (for details, see Sect. 2.4 in Steinacker et al. 2013). A spherically symmetric core with a power-law density profile with index −1.5 and flattening at a radius of 6500 AU was used to illustrate the observables for a core at the location of L260. This density profile is able to reproduce the shape of the IRAC4 surface brightness profile and is in agreement with the parameters provided in Visser et al. (2002).
The interstellar radiation field illuminating the core is partly unknown. Here, we approximate it by the anisotropic field as measured by the legacy archive microwave background data analysis (DIRBE/LAMBDA1) at the Earth location, rotated to match the core position with respect to the observer. Shadowing effects from surrounding dust clumps have not been taken into account. Further diffuse radiation is necessary to reproduce the scattering profile, an additional 1.7 times the general interstellar radiation field is necessary. Since L260 is located in a relatively bright star forming region it is to be expected that the near-infrared diffuse radiation is larger than the standard interstellar amount. The background radiation along the line-of-sight will be attenuated by the core and, in the lack of coreshine, the core would be seen in absorption relative to the background. This component therefore has to be characterised. For this we have used the DIRBE map since the absolute background is provided as opposed to the Spitzer observations. Due to the large beam of DIRBE the surface brightness in each pixel is contaminated by point sources. Although the point source contribution should be added to the diffuse radiation, it should not be considered for the line of sight background absorption. To subtract the flux from point sources we have utilized the WISE point source catalogue. The flux of all objects within the background DIRBE pixel was obtained from the catalogue and subtracted from the DIRBE value. Although the WISE observations saturate at m3.6 = 8 mag, point source photometry of the wings of the saturated stars have enabled photometry of sources up to m3.6 = 2 mag.
For the three DIRBE pixels closest to L260 the raw DIRBE values are 0.20, 0.23, and 0.18 MJy/sr, respectively. The point source contribution to each was found to be 0.12, 0.10, 0.06 MJy/sr, respectively, providing final star subtracted background estimates of 0.08, 0.13, and 0.12 MJy/sr, respectively. We used the average for the background value. The central wavelength of the DIRBE map is very close to the IRAC1 observations (3.5 vs. 3.6 μm) and the surface brightness between the two wavelengths is expected to be very similar. One caveat of the approach is the large beam of DIRBE relative to Spitzer, 42′ × 32′. Depending on the region this can in principle introduce substantial uncertainties if the background at 3.6 μm varies rapidly on smaller scales than the DIRBE beam. However, the fact that the three DIRBE beams overlapping with L260 provides similar surface brightness value after star subtraction suggests this is not the case. A similar approach was adopted for the Ks band where the 2.2 μm DIRBE map was used and the stellar contribution to the line of sight was subtracted using the 2MASS point source catalogue. The DIRBE pixel values at 2.2 μm are 0.28, 0.32, and 0.23 MJy/sr, respectively and the corresponding point source contributions were 0.23, 0.20, and 0.12 MJy/sr. We use the average value of 0.09 MJyr/sr for the line of sight background at 2.2 μm.
 |
Fig. 3 Albedo of the ice-covered silicate dust grains for different wavelengths as a function of the maximum grain size for an MRN distribution. For a maximum grain size smaller than 0.8 μm the albedo is less than 0.2 for 3.6 μm radiation. The dashed lines indicate the albedo for other common filters. |
The dust opacities and phase functions were taken from Draine & Lee (1984). The grain size distribution was assumed to be an MRN type distribution, but with varying upper size limit and different slopes. Further, the grain composition was modified from astro-silicates to pure silicates, in all cases ice covered. The presence of cloud- and coreshine shows that the scattering of the diffuse interstellar radiation field is stronger than the absorption of the background radiation such that ΔIobs = Isca + Ibge−τ − Ibg is positive (Lehtinen & Mattila 1996, Steinacker et al., in prep.). The scattering is the product of the interstellar radiation field weighted by the phase function and the albedo of the grains. Fig. 3 shows the albedo as a function of grain size for different wavelengths. Grains smaller than ~1 μm have a very small albedo for 3.6 μm radiation. Thus, if small grains are to be responsible for the observed scattering in the IRAC1 band the radiation field has to be very strong. A grain size distribution extending to 0.25 μm would only have an albedo of 0.01 and the radiation field would have to be increased by a factor of 20 stronger than the interstellar radiation field without altering the background level to compensate for the low albedo. There’s no evidence for such a strong field which leaves us with the conclusion that large grains are necessary.
 |
Fig. 4 Surface brightness profiles through the centre of a spherical model core with the overall properties of L260 and located in an enhanced diffuse radiation field (1.7 times the interstellar radiation field). Shown are the surface brightness profiles in the filters Ks (blue) and IRAC1 (red) under three different maximum sizesfor a MRN type distribution, 0.5 μm, 1.0 μm, 1.5 μm, and 2.0 μm. A cutoff at 0.5 μm does not produce any coreshine, grains of the order 1 μm are necessary. Dust properties were adopted from Draine & Lee (1984). The observed 3.6 μm surface brightness profile is shown for reference (black line). |
We show in Fig. 4 the Ks and IRAC1 surface brightness profiles for MRN (slope of −3.5) dust distributions extending to different maximal grain sizes. The adopted core mass for the test case is 1.5 M⊙, a compromise between the masses determined from the dust continuum and the dynamical mass, with the density profile described above. For a maximal grain size of 0.5 μm the Ks band shows up in emission due to the more effective scattering by large (larger than 0.25 μm) grains but the grains are not sufficiently large for effective scattering at 3.6 μm. Larger grains are necessary and for grain sizes up to 1 μm there is coreshine at 3.6 μm comparable to that observed in molecular cores. However, there will be a suppression at the centre of the Ks band surface brightness and slightly less scattering on the shadow side of the core due to the higher extinction at the core centre. The shift amounts to 2000 AU for the radiation field adopted for Ophiuchus North and the adopted core shape. The higher the column density at the centre the stronger the effect will be. This can be seen for the larger cutoffs of 1.5 and 2 μm. The 3.6 μm surface brightness is too strong simultaneously with the 2.2 μm surface brightness becoming marginally too weak. Since the effects are in opposite directions this cannot be rectified by a simple change in the optical properties of the grains. The different behaviour between the observed Ks and IRAC1 filters is thus a diagnostic of the relative abundance of small (sufficiently small so that scattering at 2.2 μm is negligible) to large grains and of the largest grain size.
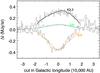 |
Fig. 5 Comparison of the surface brightness profiles in the Ks, IRAC1, and IRAC4 filters with the corresponding profiles for a model molecular cloud. The observations are shown as black histograms whereas the lines are the model profiles. |
Figure 5 shows a comparison between the observed surface brightness profiles in the Ks, IRAC1, and IRAC4 filters for L260 with the predicted surface brightness profiles for a 1.5 M⊙ model core with a flattening radius of 6500 AU, a maximal grain size of 1.0 μm, a power-law dust size distribution with a slope of −3.50 and a radiation field 1.7 times stronger than the diffuse interstellar radiation field. The 1D density model does a reasonable job at reproducing the cuts at different wavelengths across the core. We do not attempt a detailed modelling of L260 here, the aim is to show the feasibility of shorter wavelength observations to constrain the dust properties through the combination of extinction and scattering.
Only very few large grains (more than 0.5 μm) are necessary to produce the observed scattering. With the slope adopted only some 4.6× 10⁻⁶ of the grains would be larger than 0.5 μm. However, they would contain 25% of the total dust mass.
The low level of turbulence found for the core centre (0.2 ± 0.02 km s-1) is puzzling for a scenario where the grains are grown in the core due to coagulation for typical core life times of 1 Myr or less. All coagulation models rely on the relative velocities between the grains that are provided by the turbulent motions of the gas they are kinetically coupled to. Moreover, good correlation between the IRAC1 band coreshine and the IRAC4 absorption across the core suggests that there are no strong gradients in the grain size distribution which would speak for an efficient mixing of locally grown grains. Such mixing becomes difficult with low gas turbulence observed for the expected life times of molecular cores of only few free fall times (of the order 0.1 Myr; Ward-Thompson et al. 2007). With turbulent velocities of 0.2 km s-1 (Caselli et al. 2002) one core crossing time would be almost 1 Myr and several crossings would be expected to generate a smooth surface density distribution. Since the growth process is expected to last for a substantial part of the pre-stellar core lifetime, it is possible that the turbulence was stronger in the past and decayed during any contraction process. An alternative explanation is that there is no growth and that the grains were present when the core was formed. With the MRN distribution determined for the ISM that has a large-sized grain tail, invisible in extinction measurements, it has to be understood why coreshine was only detected in 50% of the sources in Pagani et al. (2010).
5. Conclusions
A simultaneous modelling of the near- and mid-infrared scattered light has the potential to constrain the higher-mass end of dust size distributions in molecular cloud cores since the scattering seen in cloudshine and coreshine is very sensitive to the largest grains. Our modelling indicates that it is very difficult to produce sufficient scattered light flux in order to explain the observed coreshine fluxes when assuming a classical MRN distribution and a maximum grain size of 0.25 μm. Larger grains
(up to ~1.0 μm) are necessary but they are possibly less abundant than predicted by an extension of the MRN distribution. Future modelling will explore the abilities for coagulation models to reproduce the observed coreshine and cloudshine surface brightness levels. In the case of the L260, we have demonstrated that low-mass cores are sensitive in the Ks band to the upper size limit of the size distribution allowing a continuous growth analysis with ground-based telescopes using scattered light.
Acknowledgments
We thank the anonymous referee for many suggestions that improved the manuscript. Part of this work was funded by the Agence National Recherche through the Chaire d’Excellence grant ANR (CHEX2011 SEED). We thank F.-X. Désert for assistance in the processing of the all sky background maps.
References
- Ascenso, J., Lada, C. J., Alves, J., Román-Zúñiga, C. G., & Lombardi, M. 2013, A&A, 549, A135 [NASA ADS] [CrossRef] [EDP Sciences] [Google Scholar]
- Bontemps, S., Andre, P., Terebey, S., & Cabrit, S. 1996, A&A, 311, 858 [NASA ADS] [Google Scholar]
- Cambrésy, L., Rho, J., Marshall, D. J., & Reach, W. T. 2011, A&A, 527, A141 [NASA ADS] [CrossRef] [EDP Sciences] [Google Scholar]
- Caselli, P., Benson, P. J., Myers, P. C., & Tafalla, M. 2002, ApJ, 572, 238 [NASA ADS] [CrossRef] [Google Scholar]
- Draine, B. T., & Lee, H. M. 1984, ApJ, 285, 89 [Google Scholar]
- Evans, N. J., II, Allen, L. E., Blake, G. A., et al. 2003, PASP, 115, 965 [NASA ADS] [CrossRef] [Google Scholar]
- Foster, J. B., & Goodman, A. A. 2006, ApJ, 636, L105 [NASA ADS] [CrossRef] [Google Scholar]
- Foster, J. B., Mandel, K. S., Pineda, J. E., et al. 2013, MNRAS, 428, 1606 [NASA ADS] [CrossRef] [Google Scholar]
- Lehtinen, K., & Mattila, K. 1996, A&A, 309, 570 [NASA ADS] [Google Scholar]
- Juvela, M., Pelkonen, V.-M., Padoan, P., & Mattila, K. 2006, A&A, 457, 877 [NASA ADS] [CrossRef] [EDP Sciences] [Google Scholar]
- Mathis, J. S., Rumpl, W., & Nordsieck, K. H. 1977, ApJ, 217, 425 [NASA ADS] [CrossRef] [Google Scholar]
- Ormel, C. W., Paszun, D., Dominik, C., & Tielens, A. G. G. M. 2009, A&A, 502, 845 [NASA ADS] [CrossRef] [EDP Sciences] [Google Scholar]
- Ossenkopf, V. 1993, A&A, 280, 617 [NASA ADS] [Google Scholar]
- Padoan, P., Juvela, M., & Pelkonen, V.-M. 2006, ApJ, 636, L101 [NASA ADS] [CrossRef] [Google Scholar]
- Pagani, L., Steinacker, J., Bacmann, A., Stutz, A., & Henning, T. 2010, Science, 329, 1622 [NASA ADS] [CrossRef] [PubMed] [Google Scholar]
- Roy, A., Martin, P. G., Polychroni, D., et al. 2013, ApJ, 763, 55 [NASA ADS] [CrossRef] [Google Scholar]
- Stepnik, B., Abergel, A., Bernard, J.-P., et al. 2003, A&A, 398, 551 [NASA ADS] [CrossRef] [EDP Sciences] [Google Scholar]
- Steinacker, J., Pagani, L., Bacmann, A., & Guieu, S. 2010, A&A, 511, A9 [NASA ADS] [CrossRef] [EDP Sciences] [Google Scholar]
- Steinacker, J., Baes, M., & Gordon, K. D. 2013, ARA&A, 51, 63 [NASA ADS] [CrossRef] [Google Scholar]
- Stutz, A. M., Rubin, M., Werner, M. W., et al. 2008, ApJ, 687, 389 [NASA ADS] [CrossRef] [Google Scholar]
- Visser, A. E., Richer, J. S., & Chandler, C. J. 2002, AJ, 124, 2756 [NASA ADS] [CrossRef] [Google Scholar]
- Ward-Thompson, D., André, P., Crutcher, R., et al. 2007, Protostars and Planets V (Tucson: University of Arizona Press), 33 [Google Scholar]
- Weidenschilling, S. J., & Ruzmaikina, T. V. 1994, ApJ, 430, 713 [NASA ADS] [CrossRef] [Google Scholar]
All Figures
|
Fig. 1 Top to bottom from left to right: the J, Ks, IRAC1, and IRAC4 images of L260. The maps are centred on (RA, Dec) = (16:47:08.35, –09:35:13) and the figures are in equatorial coordinates. Marked in IRAC4 with two asterisks is the extent of the cuts shown in Fig. 2 and the arrow indicates the location of the protostar. The field of view of each image is 108 × 98. |
| In the text | |
|
Fig. 2 Surface brightness cuts through the core L260. The location of the cut is shown in panel 4 in Fig. 1. The cuts extend along constant Galactic latitude from the right hand side in Figure 1 towards the left between the points marked with asterisks. The bright spikes most notable in the IRAC1 profile are due to stars. |
| In the text | |
|
Fig. 3 Albedo of the ice-covered silicate dust grains for different wavelengths as a function of the maximum grain size for an MRN distribution. For a maximum grain size smaller than 0.8 μm the albedo is less than 0.2 for 3.6 μm radiation. The dashed lines indicate the albedo for other common filters. |
| In the text | |
|
Fig. 4 Surface brightness profiles through the centre of a spherical model core with the overall properties of L260 and located in an enhanced diffuse radiation field (1.7 times the interstellar radiation field). Shown are the surface brightness profiles in the filters Ks (blue) and IRAC1 (red) under three different maximum sizesfor a MRN type distribution, 0.5 μm, 1.0 μm, 1.5 μm, and 2.0 μm. A cutoff at 0.5 μm does not produce any coreshine, grains of the order 1 μm are necessary. Dust properties were adopted from Draine & Lee (1984). The observed 3.6 μm surface brightness profile is shown for reference (black line). |
| In the text | |
|
Fig. 5 Comparison of the surface brightness profiles in the Ks, IRAC1, and IRAC4 filters with the corresponding profiles for a model molecular cloud. The observations are shown as black histograms whereas the lines are the model profiles. |
| In the text | |
Current usage metrics show cumulative count of Article Views (full-text article views including HTML views, PDF and ePub downloads, according to the available data) and Abstracts Views on Vision4Press platform.
Data correspond to usage on the plateform after 2015. The current usage metrics is available 48-96 hours after online publication and is updated daily on week days.
Initial download of the metrics may take a while.