Free Access
Fig. 6
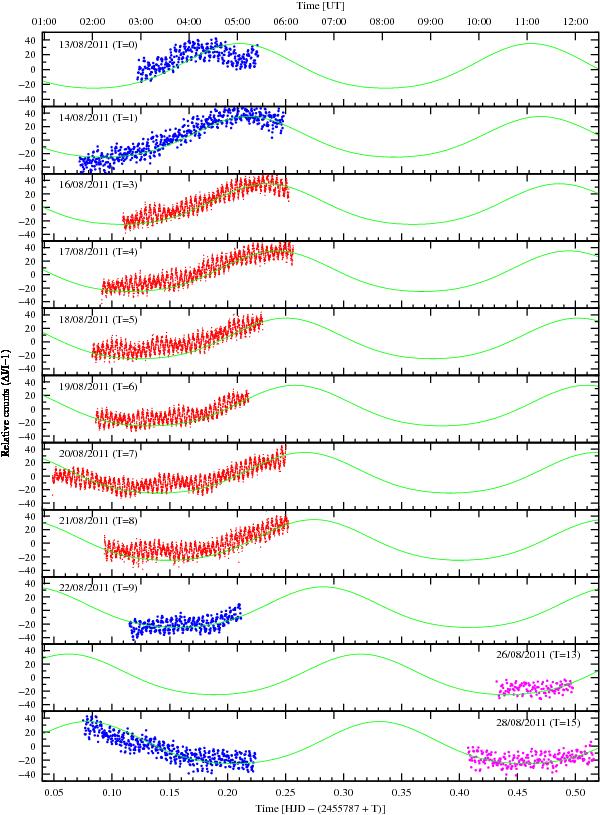
White-light data for the whole campaign. Red points mark Ultracam, blue points Merope ii, and magenta points Mexman data. The solid curve corresponds to the simple model given by Eq. (1), with the period and phase of the radial-velocity solution.
Current usage metrics show cumulative count of Article Views (full-text article views including HTML views, PDF and ePub downloads, according to the available data) and Abstracts Views on Vision4Press platform.
Data correspond to usage on the plateform after 2015. The current usage metrics is available 48-96 hours after online publication and is updated daily on week days.
Initial download of the metrics may take a while.