Fig. 1
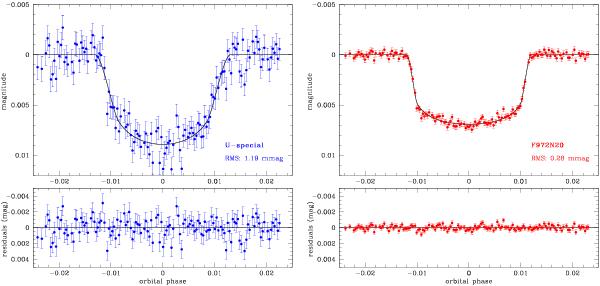
Left plot: light curve of GJ3470b gathered with the blue channel of LBC in the Uspec band, plotted with the original sampling cadence (upper panel; the black line corresponds to the best-fit model adopted in Table 1) and residuals from the best-fit model (lower panel). Right plot: same as the left plot, but in the F972N20 band of the red channel of LBC. The two light curves are simultaneous.
Current usage metrics show cumulative count of Article Views (full-text article views including HTML views, PDF and ePub downloads, according to the available data) and Abstracts Views on Vision4Press platform.
Data correspond to usage on the plateform after 2015. The current usage metrics is available 48-96 hours after online publication and is updated daily on week days.
Initial download of the metrics may take a while.