Fig. 8
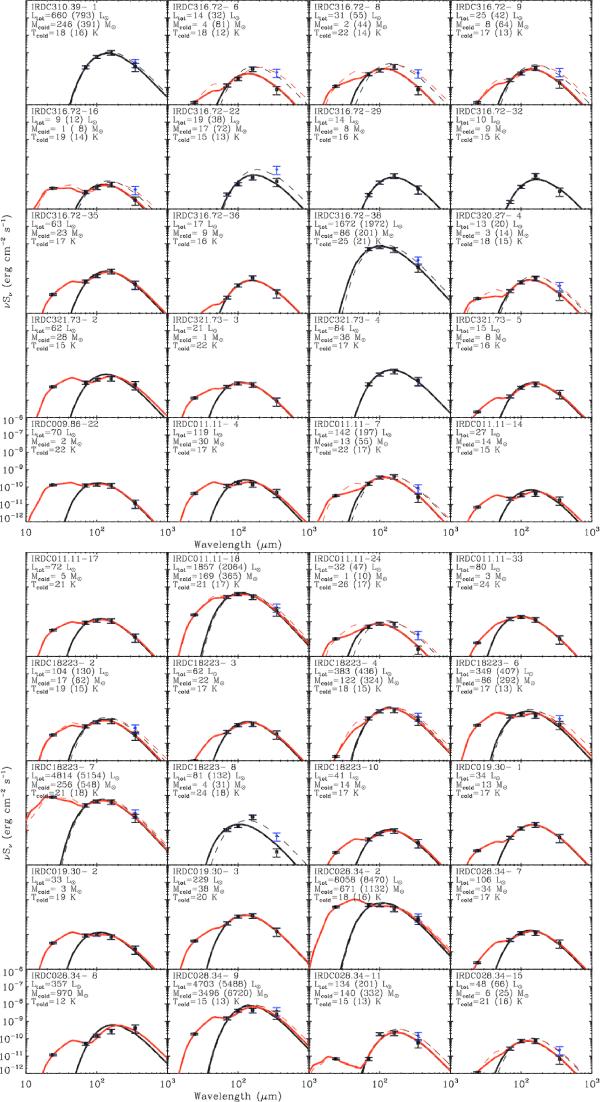
SEDs of cores with 70 μm counterparts. The IRDC name and ID number from Table B.1 are shown in the upper-left corner of each panel along with the best-fit properties to the cold component from the full-SED fit (the properties from the fit to the SED uncorrected for parent flux contribution are given in parentheses). For all objects, the solid black line shows the single-temperature fit to the data excluding the 24 μm counterpart. In cases in which a 24 μm counterpart was detected, the red line shows the summed spectrum of a two component fit. The uncorrected 350 μm flux is shown in blue, and the fits to the uncorrected SED are shown in dashed black (single component) and red (double component) lines.
Current usage metrics show cumulative count of Article Views (full-text article views including HTML views, PDF and ePub downloads, according to the available data) and Abstracts Views on Vision4Press platform.
Data correspond to usage on the plateform after 2015. The current usage metrics is available 48-96 hours after online publication and is updated daily on week days.
Initial download of the metrics may take a while.