| Issue |
A&A
Volume 559, November 2013
|
|
|---|---|---|
| Article Number | A79 | |
| Number of page(s) | 26 | |
| Section | Galactic structure, stellar clusters and populations | |
| DOI | https://doi.org/10.1051/0004-6361/201321869 | |
| Published online | 18 November 2013 | |
Online material
Appendix A: Image gallery
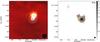 |
Fig. A.1
IRDC310.39-0.30. Left: the image is the PACS 100 μm with SPIRE 350 μm contours overplotted. The white contour levels begin at 14 Jy beam-1 and increase in steps of 5 Jy beam-1. The blue circles are PACS cores identified in Ragan et al. (2012b), and green circles are candidate 70 μm-dark cores. A circle is filled if it is recovered as a “leaf” with SABOCA, and it is left open if it is not. Cyan crosses are the positions of all dendrogram leaves. Right: SABOCA 350 μm image is plotted in grayscale with red contours showing the “leaf” structures identified with dendrogram and green contours show lower-level structures (“branches”) in emission, if any. The scalebar is in units of Jy beam-1. See Sect. 3 for details. |
| Open with DEXTER | |
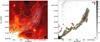 |
Fig. A.2
IRDC316.72+0.07. Left: the image is the PACS 100 μm with SPIRE 350 μm contours overplotted. The white contour levels begin at 2 Jy beam-1 and increase in steps of 4 Jy beam-1. The blue circles are PACS cores identified in Ragan et al. (2012b), and green circles are candidate 70 μm-dark cores. A circle is filled if it is recovered as a “leaf” with SABOCA, and it is left open if it is not. Cyan crosses are the positions of all dendrogram leaves. Right: SABOCA 350 μm image is plotted in grayscale with red contours showing the “leaf” structures identified with dendrogram and green contours show lower-level structures (“branches”) in emission, if any. The scalebar is in units of Jy beam-1. See Sect. 3 for details. |
| Open with DEXTER | |
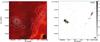 |
Fig. A.3
IRDC320.27+0.29. Left: the image is the PACS 100 μm with SPIRE 350 μm contours overplotted. The white contour levels begin at 3 Jy beam-1 and increase in steps of 1 Jy beam-1. The blue circles are PACS cores identified in Ragan et al. (2012b), and green circles are candidate 70 μm-dark cores. A circle is filled if it is recovered as a “leaf” with SABOCA, and it is left open if it is not. Cyan crosses are the positions of all dendrogram leaves. Right: SABOCA 350 μm image is plotted in grayscale with red contours showing the “leaf” structures identified with dendrogram and green contours show lower-level structures (“branches”) in emission, if any. The scalebar is in units of Jy beam-1. See Sect. 3 for details. |
| Open with DEXTER | |
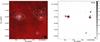 |
Fig. A.4
IRDC321.73+0.05. Left: the image is the PACS 100 μm with SPIRE 350 μm contours overplotted. The white contour levels begin at 5 Jy beam-1 and increase in steps of 2 Jy beam-1. The blue circles are PACS cores identified in Ragan et al. (2012b), and green circles are candidate 70 μm-dark cores. A circle is filled if it is recovered as a “leaf” with SABOCA, and it is left open if it is not. Cyan crosses are the positions of all dendrogram leaves. Right: SABOCA 350 μm image is plotted in grayscale with red contours showing the “leaf” structures identified with dendrogram and green contours show lower-level structures (“branches”) in emission, if any. The scalebar is in units of Jy beam-1. See Sect. 3 for details. |
| Open with DEXTER | |
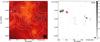 |
Fig. A.5
IRDC004.36-0.06. Left: the image is the PACS 100 μm with SPIRE 350 μm contours overplotted. The white contour levels begin at 4 Jy beam-1 and increase in steps of 1 Jy beam-1. The blue circles are PACS cores identified in Ragan et al. (2012b), and green circles are candidate 70 μm-dark cores. A circle is filled if it is recovered as a “leaf” with SABOCA, and it is left open if it is not. Cyan crosses are the positions of all dendrogram leaves. Right: SABOCA 350 μm image is plotted in grayscale with red contours showing the “leaf” structures identified with dendrogram and green contours show lower-level structures (“branches”) in emission, if any. The scalebar is in units of Jy beam-1. See Sect. 3 for details. |
| Open with DEXTER | |
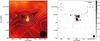 |
Fig. A.6
IRDC009.86-0.04. Left: the image is the PACS 100 μm with SPIRE 350 μm contours overplotted. The white contour levels begin at 4 Jy beam-1 and increase in steps of 1 Jy beam-1. The blue circles are PACS cores identified in Ragan et al. (2012b), and green circles are candidate 70 μm-dark cores. A circle is filled if it is recovered as a “leaf” with SABOCA, and it is left open if it is not. Cyan crosses are the positions of all dendrogram leaves. Right: SABOCA 350 μm image is plotted in grayscale with red contours showing the “leaf” structures identified with dendrogram and green contours show lower-level structures (“branches”) in emission, if any. The scalebar is in units of Jy beam-1. See Sect. 3 for details. |
| Open with DEXTER | |
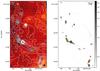 |
Fig. A.7
IRDC011.11-0.12. Left: the image is the PACS 100 μm with SPIRE 350 μm contours overplotted. The white contour levels begin at 4 Jy beam-1 and increase in steps of 2 Jy beam-1. The blue circles are PACS cores identified in Ragan et al. (2012b), and green circles are candidate 70 μm-dark cores. A circle is filled if it is recovered as a “leaf” with SABOCA, and it is left open if it is not. Cyan crosses are the positions of all dendrogram leaves. Right: SABOCA 350 μm image is plotted in grayscale with red contours showing the “leaf” structures identified with dendrogram and green contours show lower-level structures (“branches”) in emission, if any. The scalebar is in units of Jy beam-1. See Sect. 3 for details. |
| Open with DEXTER | |
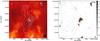 |
Fig. A.8
IRDC015.05+0.09. Left: the image is the PACS 100 μm with SPIRE 350 μm contours overplotted. The white contour levels begin at 8 Jy beam-1 and increase in steps of 1 Jy beam-1. The blue circles are PACS cores identified in Ragan et al. (2012b), and green circles are candidate 70 μm-dark cores. A circle is filled if it is recovered as a “leaf” with SABOCA, and it is left open if it is not. Cyan crosses are the positions of all dendrogram leaves. Right: SABOCA 350 μm image is plotted in grayscale with red contours showing the “leaf” structures identified with dendrogram and green contours show lower-level structures (“branches”) in emission, if any. The scalebar is in units of Jy beam-1. See Sect. 3 for details. |
| Open with DEXTER | |
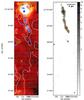 |
Fig. A.9
IRDC 18223. Left: the image is the PACS 100 μm with SPIRE 350 μm contours overplotted. The white contour levels begin at 4 Jy beam-1 and increase in steps of 4 Jy beam-1. The blue circles are PACS cores identified in Ragan et al. (2012b), and green circles are candidate 70 μm-dark cores. A circle is filled if it is recovered as a “leaf” with SABOCA, and it is left open if it is not. Cyan crosses are the positions of all dendrogram leaves. Right: SABOCA 350 μm image is plotted in grayscale with red contours showing the “leaf” structures identified with dendrogram and green contours show lower-level structures (“branches”) in emission, if any. The scalebar is in units of Jy beam-1. See Sect. 3 for details. |
| Open with DEXTER | |
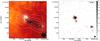 |
Fig. A.10
IRDC019.30+0.07. Left: the image is the PACS 100 μm with SPIRE 350 μm contours overplotted. The white contour levels begin at 5 Jy beam-1 and increase in steps of 2 Jy beam-1. The blue circles are PACS cores identified in Ragan et al. (2012b), and green circles are candidate 70 μm-dark cores. A circle is filled if it is recovered as a “leaf” with SABOCA, and it is left open if it is not. Cyan crosses are the positions of all dendrogram leaves. Right: SABOCA 350 μm image is plotted in grayscale with red contours showing the “leaf” structures identified with dendrogram and green contours show lower-level structures (“branches”) in emission, if any. The scalebar is in units of Jy beam-1. See Sect. 3 for details. |
| Open with DEXTER | |
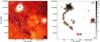 |
Fig. A.11
IRDC028.34+0.06. Left: the image is the PACS 100 μm with SPIRE 350 μm contours overplotted. The white contour levels begin at 16 Jy beam-1 and increase in steps of 5 Jy beam-1. The blue circles are PACS cores identified in Ragan et al. (2012b), and green circles are candidate 70 μm-dark cores. A circle is filled if it is recovered as a “leaf” with SABOCA, and it is left open if it is not. Cyan crosses are the positions of all dendrogram leaves. Right: SABOCA 350 μm image is plotted in grayscale with red contours showing the “leaf” structures identified with dendrogram and green contours show lower-level structures (“branches”) in emission, if any. The scalebar is in units of Jy beam-1. See Sect. 3 for details. |
| Open with DEXTER | |
Appendix B: Dendrogram leaves
Leaves from dendrogram decomposition of SABOCA 350 μm image.
© ESO, 2013
Current usage metrics show cumulative count of Article Views (full-text article views including HTML views, PDF and ePub downloads, according to the available data) and Abstracts Views on Vision4Press platform.
Data correspond to usage on the plateform after 2015. The current usage metrics is available 48-96 hours after online publication and is updated daily on week days.
Initial download of the metrics may take a while.