Fig. 2
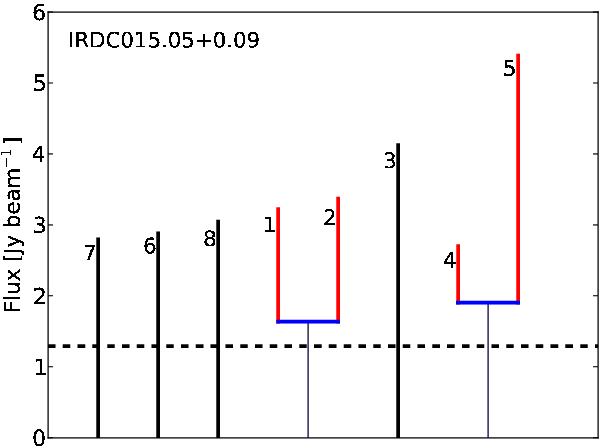
Example of dendrogram tree structure for IRDC 015.05+0.09. The indices are those listed in Table B.1 in order of increasing right ascension. The black leaves (3, 6, 7, and 8) have no parent tree structure, and the red leaves are nested in separate trunks. Their flux values were corrected for the local merge level, which is marked in blue. The horizontal black dashed line shows the 3σ minimum flux requirement for this cloud.
Current usage metrics show cumulative count of Article Views (full-text article views including HTML views, PDF and ePub downloads, according to the available data) and Abstracts Views on Vision4Press platform.
Data correspond to usage on the plateform after 2015. The current usage metrics is available 48-96 hours after online publication and is updated daily on week days.
Initial download of the metrics may take a while.