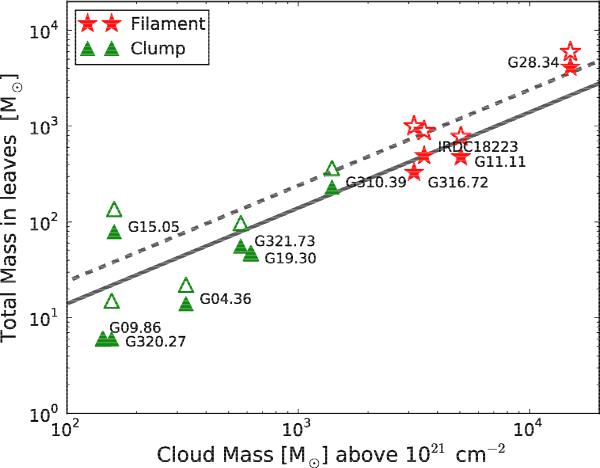
Fig. 16

Total mass in dendrogram leaves (corrected for parent structure flux assuming 20 K) as a function of the total mass of the cloud above a column density threshold NH2 ~ 1021 cm-2 (see Table 1). Filamentary clouds are marked with filled red stars, and clumpy clouds are plotted in filled green triangles. The totals uncorrected for parent flux contributions are shown in the corresponding empty symbols. The solid line shows the average fraction (14%) for mass values corrected for parent flux, and the dashed line shows the average for uncorrected mass values (24%).
Current usage metrics show cumulative count of Article Views (full-text article views including HTML views, PDF and ePub downloads, according to the available data) and Abstracts Views on Vision4Press platform.
Data correspond to usage on the plateform after 2015. The current usage metrics is available 48-96 hours after online publication and is updated daily on week days.
Initial download of the metrics may take a while.


