| Issue |
A&A
Volume 559, November 2013
|
|
|---|---|---|
| Article Number | A95 | |
| Number of page(s) | 5 | |
| Section | Celestial mechanics and astrometry | |
| DOI | https://doi.org/10.1051/0004-6361/201321806 | |
| Published online | 19 November 2013 | |
Improved VLBI measurement of the solar system acceleration⋆
1 Geoscience Australia, PO Box 378, 2601 Canberra, Australia
2 Observatoire de Paris, SYRTE, CNRS, UPMC, GRGS, 75014 Paris, France
e-mail: sebastien.lambert@obspm.fr
Received: 30 April 2013
Accepted: 8 October 2013
Aims. We propose new estimates of the secular aberration drift, which is mainly caused by the rotation of the solar system about the Galactic center, based on up-to-date VLBI observations and improved method of outlier elimination.
Methods. We fitted degree-2 vector spherical harmonics to the extragalactic radio source proper motion field derived from geodetic VLBI observations during 1979–2013. We paid particular attention to the outlier elimination procedure that removes outliers from (i) radio source coordinate time series and (ii) the proper motion sample.
Results. We obtain more accurate values of the Solar system acceleration than in our previous paper. The acceleration vector is oriented towards the Galactic center within ~7°. The component perpendicular to the Galactic plane is statistically insignificant. We show that an insufficient cleaning of the data set can lead to strong variations in the dipole amplitude and orientation, and hence to statistically biased results.
Key words: astrometry / reference systems
Proper motion data used for the DR solution is only available in electronic form at the CDS via anonymous ftp to cdsarc.u-strasbg.fr (130.79.128.5) or via http://cdsarc.u-strasbg.fr/viz-bin/qcat?J/A+A/559/A95
© ESO, 2013
1. Introduction
The accelerated motion of the solar system in the Universe, which is mainly caused by its rotation about the Galactic center, induces an apparent proper motion of extragalactic objects of a few microseconds of arc per year (μas/yr), called secular aberration drift, in the direction of the acceleration vector. This effect can be detected in the systematic part of the proper motion field.
The detection of the secular aberration drift in the positions of extragalactic radio sources observed by very long baseline interferometry (VLBI) in accordance with the theoretical predictions (see, e.g., Fanselow 1983; Bastian 1995; Eubanks et al. 1995; Sovers et al. 1998; Mignard 2002; Kovalevsky 2003; Kopeikin & Makarov 2006) was announced recently by Titov et al. (2011, hereafter TLG11), and Xu et al. (2012, 2013). These works provided direct measurements of the solar system acceleration in the Universe independent of a dynamical model of the Galaxy. TLG11 found an acceleration vector pointing towards the Galactic center (αG = 266.4°, δG = −28.9°) within 10° and an amplitude in agreement with predictions based on the Galactic parameters derived with other methods. Using a similar observational data set, but an alternative estimation method, Xu et al. (2012, 2013) obtained an amplitude similar to that of TLG11, but oriented about 18° north and 23° west from the Galactic center, which means a significant acceleration of the solar system perpendicularly to the Galactic plane. The authors suggested that a companion star might be orbiting the Sun in explanation of the deviation.
We report improved estimates of the secular aberration drift, making use of more recent VLBI observations. Section 2 presents some generalities about the solar system motion and the expected amplitude of the secular aberration drift. Section 3 recalls the basic equations. In Sect. 4, we study the sensitivity of the solution to the outliers and show that they can dramatically corrupt the least-squares estimates of the dipole components.
2. Solar system motion in the Galaxy
The theoretical effects of the solar system acceleration on the apparent position of distant bodies are described in many articles (see TLG11, and references therein). Recent estimates of the Galactic parameters based on trigonometric parallaxes of massive star regions (Reid et al. 2009) give distances R to the Galactic center on the order of 8.4 ± 0.6 kpc and a circular rotation speed V of 254 ± 16 km s-1 (thus a rotation period of ~200 Myr). Consistent values are obtained by other methods, for instance, stellar orbit monitoring (see, e.g., Ghez et al. 2008; Gillessen et al. 2009). The acceleration V2/R deduced from these values equals 7.9 ± 1.6 mm/s/yr. This induces a dipolar proper motion to distant bodies of amplitude 5.4 ± 0.7 μas/yr towards the Galactic center.
In the same way that the solar system rotates around the Galactic center, it also oscillates around the Galactic plane with an amplitude of 49–93 pc and a period of 52–74 Myr (Bahcall & Bahcall 1985). The solar system passed through the Galactic plane about 3 Myr ago and is now about 26 pc above it (Majaess et al. 2009). It is therefore moving towards the north Galactic pole and slowing down before returning south. The magnitude of the aberration resulting from this oscillation on a distant body proper motion can reach ~0.5 μas/yr when the solar system reaches the maximum distance from the Galactic plane. When this smaller contribution is added to the main contribution from the Galactic rotation, the apparent direction of the dipole can be displaced by about 5° from the Galactic center (Fig. 1).
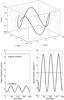 |
Fig. 1 (Top) Simulated path of the Solar system over about one revolution about the Galactic center, and contributions to the dipole (bottom left) amplitude and (bottom right) orientation for an averaged oscillation period of 63 Myr and an amplitude of 71 pc, and assuming that the Solar system crossed the Galactic plane 3 Myr ago. |
Estimated parameters (μas/yr) of the proper motion field.
3. Proper motion field parameters
We decomposed the systematic part of the proper motion field into a dipole, a rotation, and a quadrupole. Equations (8)–(9) of TLG11 appear to be vitiated. We corrected these formulae here (Eqs. (5) and (6)) and followed the convention of Mignard & Klioner (2012). The corrected TLG11 values are given in Table 1. For a distant body of equatorial coordinates (α,δ), the dipole part reads (see, e.g., Mignard & Morando 1990; Mignard & Klioner 2012)
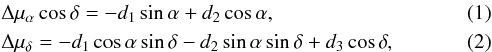 where the di are the components of the acceleration vector in units of the proper motion. In addition to the aberration distortion, there may also be a weak global rotation that can be described by the toroidal harmonics of degree 1:
 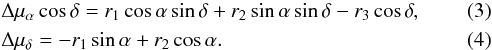 The quadrupolar anisotropy of the proper motion field is given by the development of the degree-2 vector spherical harmonics of electric (E) and magnetic (M) types:
 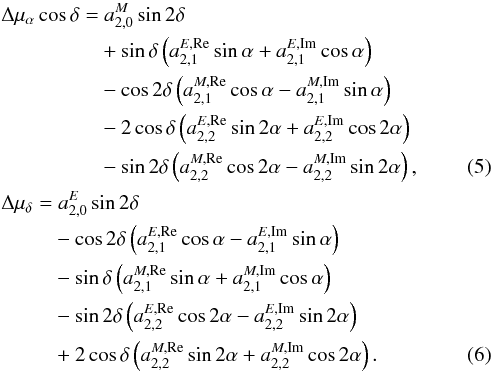 In the following, we consider two solutions: the DR solution only estimates dipole and rotation parameters, and the DRQ solution estimates the 16 parameters relevant to the dipole, the rotation, and the quadrupole.
4. Data analysis and results
The VLBI data processing made use of the analysis options extensively described in TLG11. We extend the session list to the end of February 2013. Due to the major 2011 Tohoku earthquake, several Japanese telescopes in the Tokyo area were displaced by several tens of centimeters. Consequently, these stations were removed from the no-net rotation and translation constraints, as was previously done for the Fairbanks and Concepción antennas. As in TLG11, we applied a loose constraint of no-net rotation on the radio source coordinates, with the exception of the 39 sources that showed significant nonlinear positional variations due to large scale variations in their structure (e.g., 3C 84, 3C 273B, 3C 279, 3C 345, 3C 454.3, 4C 39.25) as pointed out in Fey et al. (2010). In TLG11, we emphasized that the constraint is expected to be loose enough to allow the reference frame axes to deform slowly.
The analysis returned coordinate time series for 3635 extragalactic radio sources, 707 of which were observed in more than one session. In each time series, data points obtained from fewer then three delays were removed. Data points whose distance to the mean was higher than a certain threshold Ts times the uncertainty were also removed. This elimination was repeated until the χ2 was reasonably close to unity. The removed outliers are generally associated with unreliable networks or corrupted data.
Proper motions were then computed by the least-squares fit to time series longer than ten sessions weighted by the inverse of the squared errors. (The influence of the minimum number of sessions was checked afterwards and found to be negligible.) Note that the VLBI analysis software package used here allows direct computation of proper motions from VLBI delays. Proper motions obtained by this method appear to be very different from those obtained by fitting to time series. The difference may arise because the software package does not remove bad observations and therefore derives biased estimates. These discrepancies should be investigated by the community in the future.
The next step consisted of fitting the proper motion field parameters. Fitting the dipole and rotation parameters to the data with Ts in a range of 10 to 100 gives a dipole of amplitude ~6 μas/yr oriented towards α ~ 280 ± 15° and δ ~ −35 ± 15°, which is consistent with the values expected from the theory. However, proper motions adjusted in the previous step can be unreliable due to two major reasons. Firstly, strong, frequently observed radio sources have very small formal errors. However, some of them show very strong nonlinear positional variations and/or significant apparent motion due to relativistic jets and intrinsic radio source structure (Charlot 1990; Fey et al. 2004). Fortunately, these astrometrically unstable radio sources are well known in advance and we were able to remove them from the sample. Secondly, some radio sources with a small number of observations can exhibit extremely large proper motions compared to the global rms. These radio sources have the same impact on the solution as the frequently observed ones and should be removed from the sample. The problem is that these radio sources are not known in advance. They can only be identified after a preliminary solution by inspecting the proper motion sample. To identify and remove these spurious proper motions, the systematics were first estimated and removed, and then the sources with residual velocities higher than a threshold Tp times the residual rms were eliminated from the sample. The process was iterated a few times to convergence.
To illustrate the usefulness of this elimination algorithm, we took Ts = 90 and estimated the dipole parameters through the obtained velocity field. We obtained 6.3 μas/yr, α = 275°, δ = −30°. Then, we introduced a fake source located at the Vernal point with a spurious proper motion of magnitude 10 mas/yr ± 50 μas/yr both in right ascension and declination. The fit gave 3.5 μas/yr, α = 304°, δ = 2°.
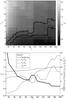 |
Fig. 2 (Top) Reduced χ2 vs. Ts and Tp. The contour indicates the region wherein 0.95 < χ2 < 1.05. (Bottom) Results of the adjustment vs. Ts obtained with Tp = 7. σd is the formal error on the dipole amplitude. |
Correlations between parameters in the DR solution.
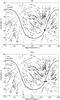 |
Fig. 3 Dipole pattern obtained from the DR (top) and DRQ (bottom) solutions. The solid line indicates the Galactic plane. The black disk and the circled cross indicate the Galactic center and the direction of the dipole, respectively. |
Correlations between parameters in the DRQ solution.
We tried several values of the thresholds Ts and Tp. Figure 2 displays the results of the different adjustments with a contour delimiting the region where the χ2 is close to 1. This occurs for Tp preferably close to 7. We took this value to determine the sensitivy of the fit to Ts (bottom panel of Fig. 2). The region for which χ2 approaches 1 with the lower postfit rms is narrow and located around Ts = 90. In this region, the dipole is oriented towards the Galactic center. Lowering Ts leads to a lower formal error on the dipole parameters, but also to a χ2 significantly far from 1. In contrast, higher values of Ts (equivalent to imposing no outlier elimination) produce large offsets to the Galactic center and the departure of the χ2 from unity.
Table 1 reports the dipole, rotation, and quadrupole parameters obtained using Ts = 90 and Tp = 7. Proper motions of the 429 sources are made available electronically. The rightmost column of this table also shows the results of Table 3 of TLG11 obtained when using Eqs. (5) and (6) of our paper. With respect to TLG11, the dipole standard error has improved by about 20% and the postfit rms was reduced by 28%. No statistically significant rotation and quadrupole harmonics were found. Tables 2 and 3 display the correlations between the various parameters, which are larger than 0.4 between d1 and r2, d2 and r1, and d3 and  . The pattern obtained for the dipole is plotted in Fig. 3.
The total acceleration of the solar system barycentre from the DR solution is (9.3, 0.4, 0.3) ± (1.1, 1.1, 1.3) mm/s/yr in the Galactic reference frame. The centripetal acceleration is 9.3 ± 1.1 mm/s/yr. Assuming R = 8.4 kpc, it is equivalent to a circular rotation speed in the Galactic plane of 282 ± 32 km s-1. The acceleration exhibits a component perpendicular to the Galactic plane statistically insignificant. For the DRQ solution, the acceleration amounts to (10.1, 1.0, − 1.3) ± (1.2, 1.3, 1.4) mm/s/yr in the Galactic reference frame, equivalent to a rotation speed of 303 ± 34 km s-1. The vertical component is also statistically insignificant.
5. Conclusion
This study showed that our previous determination of the secular aberration drift (Titov et al. 2011) is robust after adding new VLBI data. The results are consistent with predictions from Galactic models. The quasar proper motion field exhibits a dipole component oriented towards the Galactic center within ~7°. However, the quadrupole component remains statistically insignificant.
A key point of our computation was elimining outlier data points and proper motions. We showed that this step must be considered with great care: if bad data are not properly identified and eliminated, they are likely to significantly perturb the estimates and lead to statistically biased results.
Acknowledgments
The authors thank Laura Stanford and Craig Harrison of Geoscience Australia for proof-reading the manuscript and for valuable comments. O.T. gratefully acknowledges the financial support from the Paris Observatory, which made possible a one-month stay in Paris. This paper has been published with permission of the Chief Executive Officer of Geoscience Australia. The authors also thank an anonymous referee for valuable comments and suggestions.
References
- Bahcall, J. N., & Bahcall, S. 1985, Nature, 316, 706 [NASA ADS] [CrossRef] [Google Scholar]
- Bastian, U. 1995, In Proc. RGO-ESA Workshop on Future Possibilities for Astrometry in Space, eds. M. A. C. Perryman, & F. Van Leeuwen, ESA SP, 379, 99 [Google Scholar]
- Charlot, P. 1990, AJ, 99, 1309 [NASA ADS] [CrossRef] [Google Scholar]
- Eubanks, T. M., Matsakis, D. N., Josties, F. J., et al. 1995, In IAU Symp. 166, eds. E. Hog, & P. K. Seidelmann (Dordrecht: Kluwer Academic Publishers), 283 [Google Scholar]
- Fanselow, J. L. 1983, Observation Model and Parameter Partials for the JPL VLBI Parameter Estimation Software MASTERFIT-V1.0 (JPL Publication), 83–39 [Google Scholar]
- Fey, A. L., Ma, C., Arias, E. F., et al. 2004, AJ, 127, 3587 [NASA ADS] [CrossRef] [Google Scholar]
- Fey, A. L., Gordon, D. G., & Jacobs, C. S. 2010, The Second Realization of the International Celestial Reference Frame by Very Long Baseline Interferometry, IERS Technical Note 35 (Frankfurt am Main: Verlag des Bundesamts für Kartographie und Geodäsie) [Google Scholar]
- Ghez, A. M., Salim, S., Weinberg, N. N., et al. 2008, AJ, 689, 1044 [NASA ADS] [CrossRef] [Google Scholar]
- Gillessen, S., Eisenhauer, F., Trippe, S., et al. 2009, ApJ, 692, 1075 [NASA ADS] [CrossRef] [Google Scholar]
- Kopeikin, S. M., & Makarov, V. V. 2006, AJ, 131, 1471 [NASA ADS] [CrossRef] [Google Scholar]
- Kovalevsky, J. 2003, A&A, 404, 743 [NASA ADS] [CrossRef] [EDP Sciences] [Google Scholar]
- Majaess, D. J., Turner, D. G., & Lane, D. J. 2009, MNRAS, 398, 263 [NASA ADS] [CrossRef] [Google Scholar]
- Mignard, F. 2002, In GAIA: A European Space Projet, eds. O. Bienaymé, & C. Turon, EAS Publ. Ser., 2, 327 [Google Scholar]
- Mignard, F., & Klioner, S. 2012, A&A, 574, A59 [NASA ADS] [CrossRef] [EDP Sciences] [Google Scholar]
- Mignard, F., & Morando, B. 1990, in Proc. Journées 1990 Systèmes de Référence Spatio-Temporels, Observatoire de Paris, eds. N. Capitaine, & S. Débarbat, 151 [Google Scholar]
- Perryman, M. A. C., de Boer, K. S., Gilmore, G., et al. 2001, A&A, 369, 339 [NASA ADS] [CrossRef] [EDP Sciences] [Google Scholar]
- Reid, M. J., Menten, K. M., Zheng, X. W., et al. 2009, ApJ, 700, 137 [NASA ADS] [CrossRef] [Google Scholar]
- Sovers, O. J., Fanselow, J. L., & Jacobs, C. S. 1998, Rev. Mod. Phys., 70, 1393 [NASA ADS] [CrossRef] [Google Scholar]
- Titov, O., Lambert, S., & Gontier, A.-M. 2011, A&A, 529, A91 [NASA ADS] [CrossRef] [EDP Sciences] [Google Scholar]
- Xu, M. H., Wang, G. L., & Zhao, M. 2012, A&A, 544, A135 [NASA ADS] [CrossRef] [EDP Sciences] [Google Scholar]
- Xu, M. H., Wang, G. L., & Zhao, M. 2013, MNRAS, 430, 2633 [NASA ADS] [CrossRef] [Google Scholar]
All Tables
All Figures
|
Fig. 1 (Top) Simulated path of the Solar system over about one revolution about the Galactic center, and contributions to the dipole (bottom left) amplitude and (bottom right) orientation for an averaged oscillation period of 63 Myr and an amplitude of 71 pc, and assuming that the Solar system crossed the Galactic plane 3 Myr ago. |
| In the text | |
|
Fig. 2 (Top) Reduced χ2 vs. Ts and Tp. The contour indicates the region wherein 0.95 < χ2 < 1.05. (Bottom) Results of the adjustment vs. Ts obtained with Tp = 7. σd is the formal error on the dipole amplitude. |
| In the text | |
|
Fig. 3 Dipole pattern obtained from the DR (top) and DRQ (bottom) solutions. The solid line indicates the Galactic plane. The black disk and the circled cross indicate the Galactic center and the direction of the dipole, respectively. |
| In the text | |
Current usage metrics show cumulative count of Article Views (full-text article views including HTML views, PDF and ePub downloads, according to the available data) and Abstracts Views on Vision4Press platform.
Data correspond to usage on the plateform after 2015. The current usage metrics is available 48-96 hours after online publication and is updated daily on week days.
Initial download of the metrics may take a while.