Fig. 8
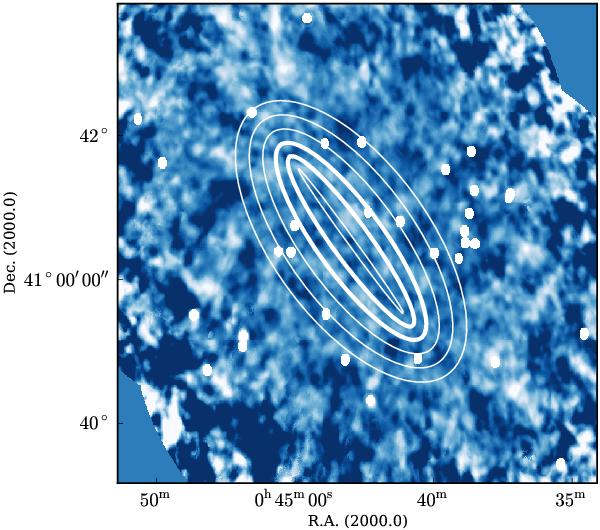
Residual polarization map after integrating each pixel over the FD ranges (−100 ± 50) rad/m2 and (+100 ± 50) rad/m2 and subtracting the results. Overlaid are the outlines of the ellipses used to integrate in the image plane. The outline of the ellipse on the 10-kpc ring is marked in boldface. Detected point sources have been masked (seen as white points).
Current usage metrics show cumulative count of Article Views (full-text article views including HTML views, PDF and ePub downloads, according to the available data) and Abstracts Views on Vision4Press platform.
Data correspond to usage on the plateform after 2015. The current usage metrics is available 48-96 hours after online publication and is updated daily on week days.
Initial download of the metrics may take a while.