Free Access
Fig. 4
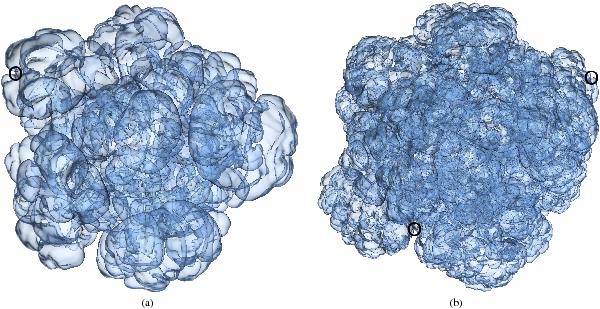
Deflagration flame (transparent iso-surface) at the time of the first DDT for both simulations. The DDT spots are encircled. a) Simulation with 2563 grid cells. b) Simulation with 5123 grid cells.
This figure is made of several images, please see below:
Current usage metrics show cumulative count of Article Views (full-text article views including HTML views, PDF and ePub downloads, according to the available data) and Abstracts Views on Vision4Press platform.
Data correspond to usage on the plateform after 2015. The current usage metrics is available 48-96 hours after online publication and is updated daily on week days.
Initial download of the metrics may take a while.