Free Access
Fig. 9
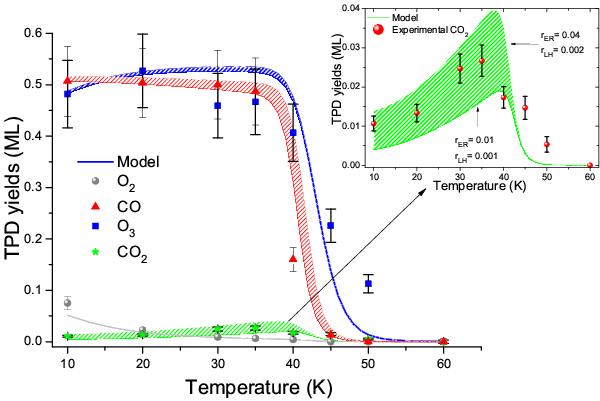
Model results for all species on ASW. The curves in this figure were obtained by using rLH = 0.0019 ± 0.0005 and rER = 0.021 ± 0.007. The circles, stars, triangles and squares represent O2, CO2, CO, and O3 experimental results respectively. The inset displays a magnified view of the CO2 yield around its maximum for clarity.
Current usage metrics show cumulative count of Article Views (full-text article views including HTML views, PDF and ePub downloads, according to the available data) and Abstracts Views on Vision4Press platform.
Data correspond to usage on the plateform after 2015. The current usage metrics is available 48-96 hours after online publication and is updated daily on week days.
Initial download of the metrics may take a while.