Fig. 5
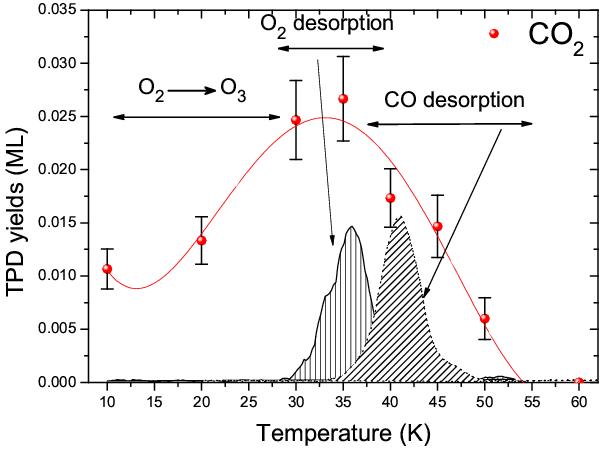
13CO2 yield as a function of surface temperature during deposition of 0.5 ML of 13CO + O. Circles represent the integrated area under the TPD curves of mass 45 after a deposition of 0.5 ML of 13CO + O on ASW ice held at different temperatures (10 K, 20 K, 30 K, 35 K, 40 K, 45 K, 50 K, 60 K). The solid line is a fit of the area behaviour. The TPD peaks (obtained at Tsurface = 20 K) added in the figure show when O2 and 13CO desorb, and this helps interpret the 13CO2 yield behaviour with temperature.
Current usage metrics show cumulative count of Article Views (full-text article views including HTML views, PDF and ePub downloads, according to the available data) and Abstracts Views on Vision4Press platform.
Data correspond to usage on the plateform after 2015. The current usage metrics is available 48-96 hours after online publication and is updated daily on week days.
Initial download of the metrics may take a while.