Fig. 4
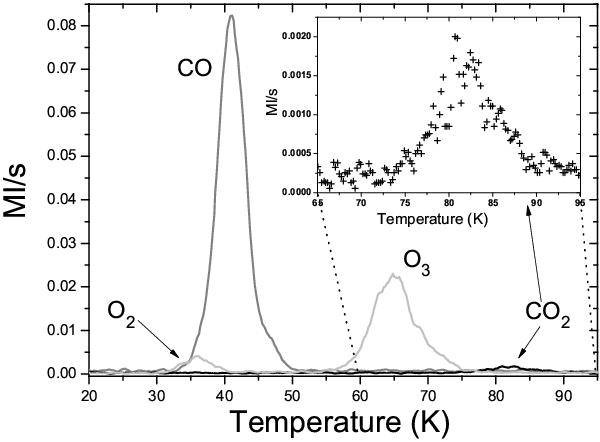
TPD curves at mass 29, 32, and 45 after irradiation of 0.5 ML of 13CO + O on ASW ice held at 20 K. Four peaks are visible. The first peak between 28 K and 42 K is due to O2 desorption, the second one between 32 and 55 K is due to 13CO desorption. The third peak between 55 K and 75 K represents O3 desorption, while the high-temperature peak is the desorption of 13CO2 (75−95 K).
Current usage metrics show cumulative count of Article Views (full-text article views including HTML views, PDF and ePub downloads, according to the available data) and Abstracts Views on Vision4Press platform.
Data correspond to usage on the plateform after 2015. The current usage metrics is available 48-96 hours after online publication and is updated daily on week days.
Initial download of the metrics may take a while.