Fig. 11
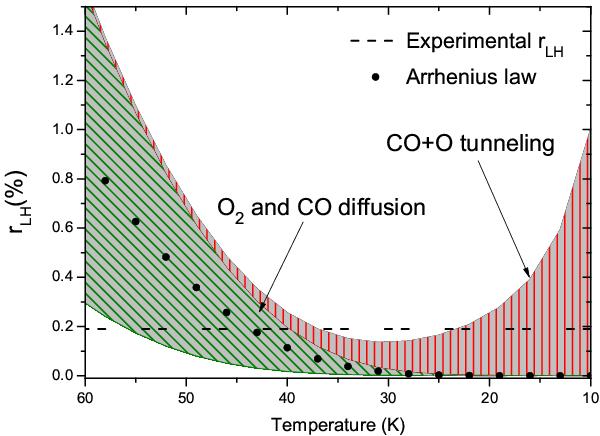
Temperature dependence of rLH(T) between 10 and 60 K. The two pinstriped regions indicate how a different parametrization of tunneling for CO + O reaction and of O2 and CO diffusion can change our estimation of rLH(T). The dashed line represents our experimental data. Full circles are an example of a pure Arrhenius behaviour.
Current usage metrics show cumulative count of Article Views (full-text article views including HTML views, PDF and ePub downloads, according to the available data) and Abstracts Views on Vision4Press platform.
Data correspond to usage on the plateform after 2015. The current usage metrics is available 48-96 hours after online publication and is updated daily on week days.
Initial download of the metrics may take a while.