| Issue |
A&A
Volume 559, November 2013
|
|
|---|---|---|
| Article Number | A121 | |
| Number of page(s) | 14 | |
| Section | Stellar atmospheres | |
| DOI | https://doi.org/10.1051/0004-6361/201321262 | |
| Published online | 26 November 2013 | |
The 2010 outburst and pre-outburst optical spectrum of the recurrent nova U Scorpii⋆
1
Indian Institute of Astrophysics,
560 034
Bangalore,
India
e-mail:
This email address is being protected from spambots. You need JavaScript enabled to view it.
2
Inter-University Center for Astronomy and
Astrophysics, Post Bag 4,
Ganeshkhind, 411
007
Pune,
India
3
National Center for Radio Astrophysics, Tata Institute of
Fundamental Research, Post Bag 3,
Ganeshkhind, 411
007
Pune,
India
4
Astrophysics Research Institute, Liverpool John Moores
University, Twelve Quays House,
Egerton Wharf, Birkenhead
CH41 1LD,
UK
5
Jeremiah Horrocks Institute for Astrophysics and Supercomputing,
University of Central Lancashire, Preston
PR1 2HE,
UK
6
Astrophysics Group, Keele University, Keele, Staffordshire
ST5 5BG,
UK
7
Jodrell Bank Centre for Astrophysics, Alan Turing Building,
University of Manchester, Manchester
M13 9PL,
UK
Received: 8 February 2013
Accepted: 23 October 2013
Abstract
Aims. We study the evolution of the recurrent nova U Scorpii during its outburst in 2010.
Methods. Optical spectroscopic observations of the nova were obtained during 0.83–162.5 days after outburst maximum. Optical linear polarisation observations were made before the onset of the super soft X-ray source (SSS) phase and during the SSS phase. Radio continuum observations were made in the 1280 MHz band during the early decline phase, and in the 610 MHz band at the onset and end of the SSS phase. We also present optical spectra obtained in the pre-outburst quiescence phase.
Results. The overall spectral evolution during the 2010 outburst is similar to the previous outbursts. However, the dense temporal coverage, especially during the early phases, reveals several short term variations not reported previously. The early phase emission line widths indicate extremely high velocities for the nova ejecta, ~10 000 km s-1. The line profiles are broad, boxy and structured. Narrow P-Cygni absorptions, at ~500 km s-1 are seen associated with the He I lines, and also the Ca II, N I and hydrogen lines (at wavelengths >8000 Å) in the spectrum of day 6.83, obtained immediately after an optical flare. This absorption component could be arising in the plasma emitting the Nitrogen lines seen in X-rays, that probably lies outside the binary orbit. Rapid variations are detected in the strength of the 4660 Å N III feature, which shows a significant increase in the line strength on days 8.83 and 13.82, at orbital phases of 0.75 and 0.25, respectively. Instrinsic polarisation is detected just before the onset, and during the SSS phase, with pv ~ 1.4% during the SSS phase. The flux variations of the N III feature and the intrinsic polarisation are most likely associated with the reforming accretion disc/stream. We estimate the mass of the ejected (hydrogen) shell to be ~4.6 × 10⁻⁶ M⊙, for a spherical shell geometry. The non-detection of U Sco in the 1280 MHz and 610 MHz radio bands is consistent with the low mass of the nova ejecta, subgiant nature of the secondary, and the distance to the nova.
Key words: stars: individual: U Scorpii / novae, cataclysmic variables / techniques: spectroscopic / techniques: polarimetric / radio continuum: stars
The spectra are only available at the CDS via anonymous ftp to cdsarc.u-strasbg.fr (130.79.128.5) or via http://cdsarc.u-strasbg.fr/viz-bin/qcat?J/A+A/559/A121
© ESO, 2013
1. Introduction
Recurrent novae (RNe) are cataclysmic binary systems that have recorded nova outbursts on recurrence timescales of a decade to a century. These binary components are a hot, massive white dwarf (MWD ≥ 1.2 M⊙) accreting material from an evolved companion, with mass transfer rates ≥10-7 M⊙ yr-1 (e.g., Starrfield et al. 1985; Kato 1991, 2002). There are ten known Galactic RNe, forming a heterogeneous group. Recent reviews on the properties of RNe can be found in Anupama (2008) and Schaefer (2010). The multiple nova explosions make these systems ideally suited for the study and understanding of accretion processes and explosions in accreting systems. Some of these systems are thought to be potential progenitors of type Ia supernovae (e.g. Starrfield et al. 2012; Kato & Hachisu 2012).
U Scorpii (U Sco) has undergone six recorded outbursts in 1863, 1906, 1936, 1979, 1987 and 1999. With the detection of additional eruptions in 1917, 1945 and 1969 in a search of archival data (Schaefer 2010, and references therein), it appears that U Sco has had outbursts at intervals of 10 ± 2 years since 1900. Based on the outburst interval, and the B magnitude in the interoutburst periods which gives a measure of the mass accretion rate, Schaefer (2005) predicted an outburst in the year 2009 ± 2. The outbursts are characterized by a fast rise to maximum, by ≳10 mag in 6–12 h, followed by an extremely fast decline from maximum, at a rate of 0.67 mag per day (Payne-Gaposchkin 1957; Sekiguchi et al. 1988; Munari et al. 1999; Schaefer 2010). The outburst spectra indicate that matter is ejected at extremely high velocities of ~10 000 km s-1, and helium enriched (Barlow et al. 1981; Williams et al. 1981; Sekiguchi et al. 1988; Munari et al. 1999; Anupama & Dewangan 2000; Iijima 2002; Evans et al. 2001). Iijima (2002), however, contests the helium enrichment estimated by others. U Sco was also detected as a supersoft X-ray source, about 19–20 days after the 1999 outburst maximum (Kahabka et al. 1999).
U Scorpii was discovered to be in outburst on 2010 January 28.4385 UT (JD 2455224.9385) by B. G. Harris and S. Dvorak (Schaefer et al. 2010a,b), making it the first such star to have a predicted eruption detected. The next eruption is predicted to be in the year 2020 ± 2 (Schaefer et al. 2010b). The 2010 outburst of U Sco has been extremely well studied in all wavebands, from X-rays to the radio. These observations confirm the fast decline, presence of high ejection velocities and a supersoft X-ray phase that lasts for about 15–20 days. In addition, a few new phenomena have also been detected during the evolution of the outburst. Optical and near-infrared data on the evolution of the 2010 outburst are presented by Munari et al. (2010), Yamanaka et al. (2010), Diaz et al. (2010), Kafka & Williams (2011), Banerjee et al. (2010), Mason 2011, Maxwell et al. (2012) and Mason et al. (2012), while the X-ray observations are presented by Ness et al. (2012) and Orio et al. (2013).
U Sco has an orbital period of 1.23 days and is detected to be an eclipsing binary at quiescence. The quiescent magnitude outside eclipse is V ≈ 17.6 mag, with the magnitude going down to V = 18.9 mag at total eclipse (Hanes 1985; Schaefer & Ringwald 1995; Schaefer 2010). The orbital period implies the secondary is a subgiant (Anupama & Dewangan 2000; Thoroughgood et al. 2001), with the accretion being driven by the evolutionary expansion of this star. Based on the observations during eclipses, Schaefer (2010) estimates the distance to the nova to be 12 ± 2 kpc.
We present in this paper the spectral evolution of the 2010 outburst based on multi-epoch optical spectra, obtained during 0.58–162.23 days since outburst discovery. Also presented are the results of linear polarimetry in the BVR bands and multi-epoch radio continuum observations in the 1280 MHz and 610 MHz bands. In addition, pre-outburst quiescence spectra are also presented.
Log of optical spectroscopic observations.
2. Observations
2.1. Spectroscopy
Spectroscopic observations of U Sco were obtained from 2010 January 29 (JD 2455225.521) to 2010 July 9 (JD 2455387.173), covering the period 0.583d to 162.284d since discovery. The spectra were obtained in the wavelength ranges 3500–7000 Å and 5200–9200 Å using grisms Gr#7 and Gr#8 available with the Himalaya Faint Object Spectrograph Camera (HFOSC), mounted on the 2 m Himalayan Chandra Telescope (HCT) located at the Indian Astronomical Observatory (IAO), Hanle, India. The log of spectroscopic observations is given in Table 1. Arc lamp spectra of FeNe and FeAr were obtained for wavelength calibration. Spectroscopic data reduction was performed in the standard manner using the various tasks available within IRAF1. All spectra were bias subtracted, flat-fielded and the one dimensional spectra extracted using the optimal extraction method. Wavelength calibration was effected using the arc lamp spectra. The spectra were flux calibrated by correcting for the instrumental response using response curves estimated from the spectra of spectrophotometric standards that were observed on the same night. For the nights that standard star spectra were not available, the response curve obtained during observations on nearby nights was used. The flux calibrated spectra in the two regions were then combined, scaled to a weighted mean to give the final spectrum. This spectrum was then brought to an absolute flux scale using zero points determined from broad-band magnitudes reported by Pagnotta et al. (2010).
A few spectra were also obtained on three nights using the IUCAA Girawali Observatory’s 2 m IGO telescope (Gupta et al. 2002). The spectra were obtained in the wavelength ranges 3300–6300 Å and 5200–10300 Å using grisms IFORS5 and IFORC5 available with the IFOSC instrument (Gupta et al. 2002). All spectra were bias subtracted, flat-field corrected and extracted in the standard manner, and wavelength calibrated using the calibration sources available with the IFOSC instrument. Since no spectrophotometric standards were obtained, flux calibration has not been applied to the spectra. Several short exposure spectra were obtained on each night of observation. These spectra were grouped and co-added. The epochs of the co-added IGO spectra are also given in Table 1.
U Scorpii was also observed at quiescence on 2006 April 24 and 2009 May 27. Spectra were obtained in the wavelength range 3500–7000 Å using the HFOSC instrument on the HCT. Two spectra, each of 1800s, corresponding to orbital phases 0.72 and 0.76 were obtained in 2006 April. Likewise, two spectra of 1800s were obtained in 2009 May also. However, since the signal-to-noise ratio of the individual spectra was poor, the May spectra were combined before extraction. The mid-UT of the combined May spectrum corresponds to an orbital phase of 0.166. All the three quiescence spectra were reduced in the manner given above. After correction for the instrumental response using a spectrophotometric standard star spectrum obtained on the same night, the spectra were flux calibrated using the mean magnitude and colours at quiescence (Schaefer et al. 2010b).
2.2. Polarimetry
Linear polarimetric measurements were carried out in the B, V and R bands during the nights of 2010 February 2, 3, 23 and 24, using the IFOSC instrument. The polarimeter uses a half-wave plate to rotate the position angle of the incoming polarisation vector and records two linear polarisation components on the CCD simultaneously by using a Wollaston prism analyzer.
The data were analyzed using IRAF aperture photometry tasks and polarisation was derived using custom polarimetry packages. The standard polarised star HD 155197 was observed on 2010 February 23 to determine the instrumental polarisation. The derived linear polarisation and position angle values of HD 155197 match well with published values of pB = 4.112%; θ = 102.94°, pV = 4.320%; θ = 102.84°, pR = 4.274%; θ = 102.88° (e.g. Schmidt et al. 1992).
The estimates of the linear polarisation and position angle for U Sco are given in Table 2, and plotted in Fig. 1. An increase in the polarisation values is noticed as the outburst progresses. A change in the position angle by almost 90 degrees is seen between the early epoch observations and those at the later epochs.
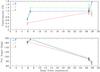 |
Fig. 1 Observed linear polarisation measurements (top panel) and position angle (bottom panel) in U Sco. Note the increase in the polarisation values, and also a change in the position angle. |
Linear polarisation: observations.
2.3. Radio continuum
Low frequency radio continuum observations were made using the Giant-Meterwave Radio Telescope (GMRT). The first observation was made on 2010 January 29, in the 1280 MHz band. Subsequent observations, on 2010 February 11 and March 2, were made in the 610 MHz band.
The data obtained in native “LTA” format were converted to standard FITS format and analysed using standard tasks in NRAO AIPS2. Self calibration using wide-field imaging was used to improve the image quality and, on the average, two rounds of phase self calibration were found to give the best images.
Radio continuum observations.
U Sco was not detected in the radio region on any of the days it was observed. Table 3 gives the details of radio observations, as well as the upper limits on the flux densities.
3. Optical spectrum and its evolution
In general, the 2010 outburst of U Sco appears to be broadly similar to its previous outbursts in terms of the spectrum and its evolution. Optical spectra of the 1999 outburst have been presented by Munari et al. (1999), Lepine et al. (1999), Anupama & Dewangan (2000) and Iijima (2002) who also note a broad similarity of the 1999 outburst with previous well-studied ones in 1979 and 1987 (Barlow et al. 1981; Williams et al. 1981; Sekiguchi et al. 1988).
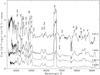 |
Fig. 2 Optical spectra of U Sco during days 0.83–3.83 after outburst maximum. The emission line identifications and day since the estimated maximum are marked. Note the changes in the line profile. For clarity, the zero level of the spectra of days 0.831, 1.825 and 2.821 are offset, respectively, by a constant value of 0.8, 0.5 and 0.3 in flux units. |
The early epoch spectra (Figs. 2, 3) were dominated by broad lines due to hydrogen Balmer, He I, N I, N II and O I. Weak, blue shifted absorption associated with the emission lines were seen in the +0.62—+1.63 d spectra presented by Yamanaka et al. (2010). In a spectrum obtained 1.17 d after maximum, Kafka & Williams (2011) detected multiple absorption systems in the Balmer Hβ (−3854, −5864 km s-1), Hγ (−3806, −5864 km s-1) and Hδ (−3786, −4304 km s-1) lines. The spectrum of 0.83 d after maximum presented here showed the absorption component, associated with the Hα, Hβ and He I 5876 lines, at an average velocity of ~4400 km s-1. The multiple absorption components were not detected due to the lower resolution of the spectrum presented here. All emission lines showed a broad, boxy profile, with triple peaks, with a broad central component flanked by narrow components. The Hα, Hβ and He I 5876 lines indicate a full width zero intensity (FWZI) velocity of ~9500 km s-1, while the He I 7065 Å line showed a FWZI of ~9900 km s-1. The full width half maximum (FWHM) of the Hα and Hβ lines indicated a velocity of ~7700 km s-1. Similar broad profiles are detected in the infrared region also (Banerjee et al. 2010).
Fe II and Mg II lines have been identified in the spectra of U Sco during the previous outbursts (e.g. Williams et al. 1981; Anupama & Dewangan 2000; Iijima 2002). Mg II 7880 Å is clearly seen in the spectrum of day 0.831, while Mg II 4481 Å is blended with He I. Likewise, the Fe II lines, in particular those due to multiplet 42 at 4924 Å, 5018 Å and 5169 Å are probably present, blended with He I and N II lines, in the spectrum of day +0.831, when the densities were high and P-Cygni absorptions were present. Based on spectral diagnostics, Williams (2012) suggests that the He/N spectra are consistent with a white dwarf ejecta origin, while the Fe II spectra are formed in a large circumbinary envelope of gas whose origin is the secondary star, and the dominance of one over the other depends on the white dwarf mass and the binary mass ratio. It is however, quite possible that all novae show Fe II lines around maximum. In the case of the Fe II lines originating in the white dwarf ejecta, these lines should have a velocity consistent with the He/N lines from the ejecta. The line blending due to the high ejecta velocity in U Sco, though, makes it difficult to differentiate between the white dwarf ejecta origin and the circumbinary origin of the Fe II lines.
Na I D absorption was clearly seen in the spectrum at 5889.2 Å and 5895.2 Å, and appears to be interstellar.
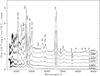 |
Fig. 3 Optical spectra of U Sco during days 4.81–9.83 after outburst maximum. The time since estimated maximum and emission line identifications are marked. Note the changes in the line profile, and the decrease in the strength of the oxygen and nitrogen lines by day ~7. For clarity, the zero level of the spectra of days 4.805, 5.806, 6.826, 7.827 and 8.826 are offset, respectively, by a constant value of 1.6, 1.3, 1.0, 0.7 and 0.3 in flux units. |
The spectrum of U Sco showed rapid variations as the nova faded. The relative strength of the feature at 5200 Å region decreased on day +1.83, probably due to the fading of Fe II lines with decrease in the densities. At the same time, it appears that N II lines gained in strength, as also the O I 8446 Å line, while other O I lines showed a weakening. O I 8446 continued to be stronger than O I 7774 Å although gradually fading. All the O I and N I lines faded considerably by day 7 (Fig. 3). The NIR spectra presented by Banerjee et al. (2010) show a similar trend in the strengths of the O I lines. Table 4 lists the fluxes of a few prominent lines during this epoch.
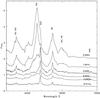 |
Fig. 4 Spectrum of U Sco during days 6.8–16.8 after outburst maximum, showing the emergence and increase in the strength of the He II lines. Note also the relative increase in the strength of the N III 4660 feature on days 8.83 and 13.82. |
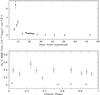 |
Fig. 5 Top panel: He II 4686 Å flux as a function of outburst phase. Note the sudden increase in the flux just before the onset of the SSS phase, and an almost constant flux during and after the SSS phase. Bottom panel: He II 4686 Å flux as a function of the orbital phase. No significant orbital phase dependence is seen. |
Line identifications and observed fluxes (in units of 10-12 erg/cm2/s) during the early phase.
3.1. Supersoft phase
U Sco was detected as a supersoft source (SSS) in the X-rays, that lasted for about a month. X-ray observations indicate a sharp turn on of the SSS phase during days 12–14, with the SSS luminosity peaking around days 26–32 (Ness et al. 2012). The SSS turned off at ~day 40. The optical light curve showed a plateau during this phase (Schlegel et al. 2010).
The He II 4686 Å line appeared just before the onset of the SSS/plateau phase, weakly present around day 7. The spectral evolution during the SSS phase is marked by an increase in the strength of the He II lines at 4686 Å and 5411 Å (Fig. 4). He II 7594 Å is also present at the blue edge of the atmospheric O2 absorption feature. The He II 4686 Å line flux variation is shown in Fig. 5. As can be seen in the figure, the He II line flux that increased prior to the onset of the SSS phase, remained almost constant, during and after the SSS phase. The strength of the other features due to hydrogen Balmer, He I, O I, and N II decreased gradually, with the hydrogen lines being the only strong features other than He II lines by day 17.
During the SSS phase, the Balmer lines were dominated by the central component, although the wings continued to be broad and weak initially. The central core of the Balmer lines strengthened during this phase, with its width narrowing with time to ~600 km s-1. The He II lines were narrow, with a width similar to, or narrower than the core of the Balmer lines. The SSS phase was dominated by the presence of the narrow emission lines of He II and the narrow Balmer lines (see Fig. 6). The fluxes of a few prominent lines during this phase are listed in Table 5.
Line identifications and observed fluxes (in units of 10-12 erg/cm2/s) during the SSS phase.
The onset of the SSS turn-off is marked by the emergence of the [O III] lines, by around day 33.
3.2. Nebular phase
The onset of the nebular phase appears to have occurred about a month after the outburst, coinciding with the SSS turn-off. The spectrum of day +33.78 presented in Fig. 7 clearly shows a broad feature around 5000 Å, corresponding to [O III] 4959+5007 Å lines. The spectrum on this day was still dominated by narrow emission lines due to He II 4686 Å, Hβ and Hα. By day +41.8, the strongest feature in the spectrum was that due to [O III] 4959+5007 Å. [N II] 5755 Å was clearly present, while the [N II] 6548 Å and 6584 Å lines could be blended with Hα. The width of the Balmer lines increased to that seen during the pre-SSS phase. Diaz et al. (2010) state the nebular phase has been observed in U Sco for the first time. However, a comparison with the spectral evolution during the 1999 outburst clearly shows the presence of [O III] nebular lines in the day 42 spectrum presented by Anupama & Dewangan (2000) and in the spectrum of ~day 50 presented by Thoroughgood et al. (2001). The strength of the [O III] lines appears greater, at similar epochs, during the present outburst.
The spectrum of day +50.80 is dominated by the broad forbidden features due to [O III] 4363 and 4959+5007 Å features and [N II] features. [Ne III] 3868 Å has been identified by Diaz et al. (2010) and Mason (2011). However, its identification in the spectrum presented is uncertain since the region is affected by noise. The He II 4686 Å feature continued to be present, while the Balmer lines were blended with the [O III] and [N II] lines. Table 6 lists the fluxes of the prominent lines during the nebular phase.
Line identifications and observed fluxes (in units of 10-13 erg/cm2/s) during the nebular phase.
The [O III] lines continued to dominate the spectrum even around day +72 (see Fig. 7). All lines showed multiple components. This spectrum, although noisy, is very similar to the spectrum of day +75 presented by Diaz et al. (2010). The forbidden lines decreased in strength, and only the [O III] 4959+5007 Å feature was present in the last spectrum presented here, obtained on day +162.49. The narrow He II 4686 Å line continued to be present, while the Balmer Hβ and Hα features were found to be broad, with multiple components. The FWZI of the Hα line was measured close to 11 000 km s-1. The Hα line could be blended with the [N II] lines, whose strength is, however, expected to be much lower (Diaz et al. 2010).
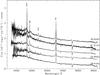 |
Fig. 6 Optical spectra of U Sco during the SSS phase. The time since maximum is marked against the spectrum. Note the general decrease in the emission line strengths. For clarity, the zero level of the spectra of days 20.822, 21.812, 22.182 and 23.805 are offset, respectively, by a constant value of 1.5, 1.1, 0.8 and 0.5 in flux units. |
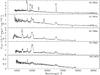 |
Fig. 7 Optical spectra of U Sco during days 33.78–50.80 after outburst maximum. Note the increase in the strength of the nebular lines, and also the increase in the line width of the Hα line after day 33.78. |
The Mg I b 5174 Å feature due to the secondary was detected during the 1979 and 1999 outbursts, approximately 40–50 days after outburst maximum (Barlow et al. 1981; Anupama & Dewangan 2000; Thoroughgood et al. 2001). A weak absorption at 5173 Å is seen in the spectrum of day 50.8. However, we are unable to confirm its identification with the Mg I b feature due to the spectrum being noisy. We also detect a broad absorption feature at ~6150 Å, which could be due to TiO. Neither feature could be identified on subsequent days. Mg I b 5174 Å could be present in the +163 d spectrum presented by Diaz et al., while the presence of the 6150 Å feature cannot be confirmed due to a break in the spectrum around this wavelength. Absorption features found in our pre-outburst quiescence spectra are discussed in Sect. 4.
3.3. Short term spectral variations
The spectrum of U Sco shows some interesting, short term variations, which were not reported during the earlier outbursts, probably due to poor temporal coverage.
The He I lines developed a sharp absorption component, which was seen only in the spectra of days 6.83 and 7.83, as shown in Fig. 8, at orbital phases of 0.13 and 0.94, respectively. The absorption dip in the He I lines indicates a velocity of ~−500 km s-1. A similar absorption dip was seen in the N I, Ca II and hydrogen Paschen lines beyond 8000 Å in the spectrum of day 6.83 (see Fig. 9). Subsequent spectra do not show this absorption component. The spectrum of day 6.83 was obtained just after an optical flare.
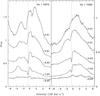 |
Fig. 8 He I 5876 Å and 7065 Å line profiles during +5.81d – +8.83d. Note the sharp dip around −500 km s-1 on days +6.83 and +7.83 |
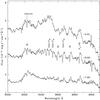 |
Fig. 9 Spectrum of U Sco during +5.81d – +7.83d in the 8200–9000 Å region, showing the sharp, blue shifted absorption associated with the N I, Ca II and hydrogen Paschen lines on day +6.83. |
While there is a gradual decrease in the line strengths, the N III feature at 4660 Å is relatively stronger on days 8.83 and 13.82 compared to the other days (Fig. 4). The sequence of spectra presented by Maxwell et al. (2012) show a similar variation, with the N III emission being stronger on day 9.43, while the feature is fainter in the spectrum of day 9.83 presented here. Fortunately, the 1979 and 1987 outbursts have spectra obtained during similar epochs that allows us to examine whether the line strength variation is related to the outburst epoch. The spectrum of day ~9 during the 1979 outburst (Barlow et al. 1981) and that around day 8–9 during the 1987 outburst (Rosino & Iijima 1988), both show a strong 4660 Å feature that declines rapidly over a day’s time. However, in contrast with the 2010 outburst, no increase in the strength of this feature is seen in the spectrum around day 13 during the 1979 outburst, implying that the variation is probably not related to the outburst epoch. We examine the possibility of an orbital phase dependence. The orbital phase on days 8.83, 9.43 and 13.82 during the 2010 outburst, when the feature is stronger, corresponds to 0.75, 0.25 and 0.25, respectively. Likewise, the orbital phases of the 1987 spectra around day 8–9 correspond to 0.95 and that of the 1979 spectrum at day ~9 corresponds to phase 0.79. The orbital phase corresponding to day 9.83 in 2010 and day 13 in 1979 when the N III feature is weak is 0.57 and 0.47, respectively. This suggests an orbital phase dependance of the N III line strength variation that is possibly associated with the reforming accretion disc/stream.
4. Pre-outburst quiescence spectrum
Barlow et al. (1981) presented a spectrum of U Sco obtained about three months before the 1979 outburst. This spectrum has a poor signal-to-noise ratio, and the only distinguishable feature is the He II 4686 emission line. The spectra during the post-1979 outburst, presented by Hanes (1985) shows emission lines of He II (4200, 4542, 4686 and 5412 Å), absorption lines of Ca II (3934 and 3968 Å) and Mg (the b triplet 5167, 5173 and 5184 Å), and the Balmer discontinuity. Hα is possibly seen at the edge.
Our spectra of 24 April 2006 show the emission lines of He II (4686, 5411 Å), Hα, Hβ, and possibly He I (5876 Å). The 27 May 2009 spectrum looks similar, except that the He I line is not seen. Absorption lines seen in all these spectra include the 4300 G-band and Na I. A comparison of the equivalent widths of the 4300 Å line indicates that the spectral type is K0-K1. The MgI b line at 5169 Å does not seem to be present. Figure 10 shows the pre-2010 outburst quiescence spectra. It appears that the inter-outburst quiescence spectra look similar, except for minor variations.
The post-outburst quiescence spectrum obtained during eclipse (Mason et al. 2012) shows Ca II H&K, the G-band and MgI b absorption features.
5. Reddening
The line of sight reddening towards U Sco was estimated to be AV = 0.6 by Barlow et al. (1981), based on (a) colour excesses of globular clusters within 5deg of U Sco, (b) the ratio of the He II 1640 Å to 4686 Å fluxes around 12 days after outburst.
Na I D interstellar absorption features are clearly detected in our spectrum of day +0.83 at 5889.22 Å and 5895.22 Å, and these may be used to estimate the reddening, using the Na I D equivalent width – E(B − V) relation of Munari & Zwitter (1997). The equivalent width of Na I D 5890 Å is measured as 0.45 ± 0.02 Å and that of the 5896 Å line is measured as 0.27 ± 0.02 Å. The equivalent width of the 5890 line indicates E(B − V) = 0.12 ± 0.01. Kafka & Williams (2011) detect two components in each of the Na I D lines, and measure the equivalent widths to be 0.313 ± 0.003 Å and 0.016 ± 0.003 Å for the 5890 line and 0.231 ± 0.003 Å and 0.044 ± 0.002 Å for the 5896 line. Following Munari & Zwitter, the equivalent widths of the 5890 Å components indicate E(B − V) = 0.11. These estimates are consistent with that of Diaz et al. (2010), E(B − V) = 0.13.
In what follows, we assume E(B − V) = 0.12, or AV = 0.4 for RV = 3.1. An E(B − V) = 0.12 corresponds to an interstellar polarisation of pV ≃ 0.54% (Serkowski et al. 1975).
6. Physical parameters of the ejected shell
The ratios of the nebular lines are normally used to determine the density and temperature conditions and chemical abundances. The standard nebular lines are, however, not present in the spectra during the early phases. An indication of the electron density and mass of the ionized gas in the ejected shell during the early phases can, nonetheless, be obtained based on the observed fluxes of the Balmer lines. The electron density Ne can be estimated by assuming the ejected shell is expanding uniformly and that the shell is radiation bounded. Under such an assumption, the observed flux can be expressed as  , where φ is the filling factor, Rs is the radius of the shell and d is the distance to the nova (see e.g. Gehrz 2008, and references therein). The mass of hydrogen in the shell can be estimated using MH = fmHd2/Neϵν, where mH is the mass of hydrogen atom, and ϵν is the hydrogen emissivity.
Assuming the shell to be expanding with a uniform velocity of 6000 km s-1, corresponding to the P-Cygni absorption component associated with the Balmer lines (Kafka & Williams 2011), and a distance of 12 kpc, we estimate the electron density and mass of the ionized gas on five different epochs, corresponding to days +2.82, +5.81, +9.83, +33.78 and +50.80, using the reddening corrected Hα and Hβ emission line fluxes. Assuming Case B conditions, the hydrogen emissivities corresponding to the Hα and Hβ lines are obtained from Storey & Hummer (1995) for a temperature of 2 × 10⁴ K. The derived electron densities (Ne) and shell mass (MH), for two filling factors, φ = 1, the spherically symmetric case, and φ = 0.001 (Williams et al. 1981; Anupama & Dewangan 2000), a clumpy shell, are listed in Table 7. The φ = 1 estimates for Ne give a lower limit, while those for MH are an upper limit. Banerjee et al. (2010) obtain similar results based on the near-IR spectra. From the table, it is seen that the Ne and MH values for φ = 0.001 are consistent with the values derived for the 1999 outburst (Anupama & Dewangan 2000), under similar assumptions.
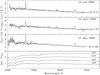 |
Fig. 10 Quiescence spectrum of U Sco in April 2006 and May 2009. The orbital phases corresponding to the epoch of the spectra are indicated. Also plotted for comparison are the standard spectra of K and G stars (bottom panel). |
Physical parameters of the ejected shell.
The helium abundance in U Sco is a matter of debate. While Barlow et al. (1981), Williams et al. (1981), Sekiguchi et al. (1988), Munari et al. (1999), Anupama & Dewangan (2000) and Evans et al. (2001) found an overabundance of helium in the ejected shell, with the abundance values (He/H) ranging from 0.4–4.5, Iijima (2002) found a helium abundance of 0.16 during the 1999 outburst, based on an early phase spectrum, and concluded the ejected shell was not helium enriched. Diaz et al. (2010), based on nebular spectra obtained during the present outburst, derive a lower limit to the helium abundance to be in the range 0.1 to 0.2, while Maxwell et al. (2012) estimate the helium abundance to be 0.073 ± 0.031, based on early phase (days 1.93–12.81) spectra. The spectra presented here allow us to estimate the helium abundance at different epochs. While only He I lines are available on days 2.82 and 5.81, both He I and He II lines are available on day 9.83, and only the He II 4686 Å line is strong enough to be used on days 33.78 and 50.80. The ionic helium abundances obtained on each of these days are tabulated in Table 7. Taking an average of the ionic abundances, we estimate the total helium abundance to be 0.21 ± 0.1. This value, although slightly higher than those of Maxwell et al. and Iijima, is much lower than the other estimates, indicating that the ejecta is most probably marginally enriched in helium, similar to most novae.
The spectrum of day 50.80 shows strong [O III] nebular lines. While the standard lines used for density estimates, i.e. the [O II] and [S II] lines are not present in the spectrum, the ratio of the [O III] lines, 4363/(4959 + 5007) can be used to estimate the temperature. Using the NEBULAR package (Shaw & Dufour 1995) within IRAF, we find that the minimum density required to produce the observed ratio of 2.1 ± 0.2 is Ne = 2.7 × 106 cm-3. The Hβ line flux indicates a density of 3.8 × 106 cm-3 (for φ = 0.001), which is consistent with the density condition required to produce the observed [O III] line ratio. Using this density, the corresponding temperature is 4.7 × 10⁴ K. The [O III] line ratio of day 72 gives a temperature of 5.1 × 10⁴ K. These estimates indicate that the [O III] region has a temperature of ~5 × 10⁴ K.
7. Discussion
The evolution of the optical spectrum of U Sco following the 2010 outburst is presented in this work. The overall evolution appears to be similar to the previous outbursts, although with some variations. While a few of the variations seen are quite likely due to a more extensive coverage in time, and at shorter time intervals, a few others could be due to differences in the physical conditions between the outbursts.
The spectra presented here confirm the presence of high velocity ejecta, with FWZI velocities ~10 000 km s-1, similar to that seen in the previous outbursts (Barlow et al. 1981; Williams et al. 1981; Munari et al. 1999; Anupama & Dewangan 2000; Iijima 2002) and also as reported during the present outburst (Banerjee et al. 2010; Kafka & Williams 2011; Yamanaka et al. 2010; Diaz et al. 2010; Mason 2011). The line profile during the very early phases is boxy and triple peaked, with a broad central component flanked by narrow components. Such boxy, triple peaked profiles are found to be generally associated with He/N and hybrid novae (e.g. V1721 Aql: Hounsell et al. 2011; V1494 Aql: Kamath et al. 2005; V2672 Oph: Munari et al. 2011; T Pyx: Shore et al. 2013), and attributed to an expanding bipolar and equatorial ring like shell structure. Drake & Orlando (2010) model the early blast wave to be collimated with clear bipolar structures. A geometry with a moderately collimated bipolar outflow was also proposed by Lepine et al. (1999). The blue and red edge components of the emission lines weaken with time. Only the central peak remains dominant, showing a simultaneous decrease in its width. The hydrogen line profiles in the nebular phase are similar to the early epoch ones. They are broad, with multiple components.
The optical light curves indicated the onset of the plateau phase by day 9, which appears to be coincident with the onset of the supersoft X-ray phase (Schlegel et al. 2010). The He II 4686 Å line appeared just before the onset of the plateau phase, showed a rapid increase in its strength during the turn-on of the SSS/plateau phase (~12–14 d), and reached a peak around day 16.8. Thereafter, the line strength decreased rapidly in a day, and remained almost constant throughout the plateau/SSS phase (Fig. 5), that lasted during days ~9–41 (Schaefer et al. 2010c). This phase was dominated by the presence of the narrow emission lines of He II and the narrow Balmer lines. The coincidence of the emergence and strengthening of the He II lines prior to, and the onset of the SSS phase is very similar to that observed in the case of nova KT Eri (Bode et al. 2010). It appears that the emergence of the He II 4686 Å line could be an indicator of the onset of the SSS phase in novae (see also Ribeiro 2011). The end of the plateau and the SSS phase was marked by the dominance of the broad [O III] lines, as well as the re-appearance of the high velocity components in the Balmer lines. These emission lines show a highly structured profile, while He II 4686 Å continues to have a narrow profile.
Our observations show that the emission from U Sco was linearly polarised in the B, V and R bands. The observed polarisation, which was almost purely interstellar at pV = 0.69%, θ = 163° on day ~5.8, was found to have increased to pV = 1.39%, θ = 175° on day ~6.8, with a marginal change in the position angle (Fig. 1). Similar levels of polarisation were detected on the two other epochs of measurements on days 26.8 and 27.8, although marginally lower on day 27.8. The absence of dust formation in U Sco (Evans et al. 2001; Banerjee et al. 2010) indicates that the intrinsic polarisation must be due to electron scattering (Evans et al. 2002). Spectropolarimetry during the 1999 outburst revealed that U Sco exhibited intrinsic polarisation only on the second day after outburst (Ikeda et al. 2000). This continuum polarisation was due to scattering in material closer to the pseudophotosphere than the more extended Hα region. They do not have observations beyond day 2.
Rapid variation in the polarisation is seen in the V band on day 26.8, while a similar rapid variation is seen in the B band on day 27.8 (Table 2). There is no significant change in the position angle during these variations. We should note the caveat that, as the filters are broad, they include both emission lines and continuum; the observed polarimetric variation could be due to either emission line or continuum variability. We are unable to comment further on whether this variation is orbital phase dependent due to lack of data.
The XMM-Newton observations on days 22.9 and 34.9 (Ness et al. 2012) showed smooth eclipses in UV and optical, but deep dips in the X-ray light curve on day 22.9. The X-ray dips disappeared by day 34.9, showing clean eclipses in all bands. Ness et al. interpret the dipping as the result of occultations of the central source by high-density absorbing gas aligned along the trajectory of an accretion disc that is reforming. The continued outflow from the nova disrupts the accretion stream into fragments that intersect the line of sight. The absence of the dips on day 34.9 is interpreted as being due to stopping of the outflow after nuclear burning ceases, allowing the accretion stream to circularise and condense into a flat accretion disc. We interpret the observed intrinsic polarisation as being due to the accretion stream. The absence of an intrinsic component on day 5.8, while intrinsic polarisation component was detected on day 6.8, indicates that the disc formation probably began around day 6.
There is a major change in polarisation position angle, from ~160 to ~88 degrees, between days 4.034 and 23.965 (Fig. 1). Initially, we might expect the scattering to be primarily from the disc, but during the eruption the scattering would primarily be from the jets, which are at ~90 degrees to the disc, roughly the change in position angle seen. We note that there might still be a polarisation contribution from the disc so the observed polarisation would be the vector sum of the disc and jet contributions. We are unable to comment on the behaviour post the SSS/plateau phase, when the disc is supposed to have circularised, due to lack of polarisation observations.
The mass in the ejected nova shell and the helium abundance are factors that are of importance while considering U Sco as a candidate progenitor of type Ia supernova. The estimate of the ejected mass presented in Sect. 6 is only indicative in nature as the assumed condition of Case B may not be strictly valid (see also Banerjee et al. 2010). The observed, reddening corrected Hα/Hβ ratio is ~2.3 on days +2.82, +5.81, and +50.80. On days +9.83 and +33.78 the narrow component ratio is ~1.5. The ratio is generally flatter than for Case B, which is ~2.7 for the assumed temperature, and implies a high optical depth in the Hα line. In addition, the values are strongly dependent on the assumed geometry. The ejected mass of MH ~ 4.6 × 10⁻⁶ M⊙ for a spherically symmetric geometry is similar to Mejecta = 4.3 × 10⁻⁶ M⊙ based on orbital period changes (Schaefer 2011), and 3 × 10⁻⁶ M⊙ based on photoionisation models of a clumpy ejecta (Diaz et al. 2010).
The question of helium being over abundant, or otherwise, remains unresolved. Helium abundance estimates during the previous outbursts have ranged from ~0.16 to ~4.5. For the 2010 outburst, we estimate a marginal over abundance, while Maxwell et al. (2012) find nearly solar values. The abundance is found to be sensitive to the assumed emissivity values, the emission line(s) used, and also their origin (Anupama & Dewangan 2000; Maxwell et al. 2012). For instance, the Balmer decrement for the broad and narrow lines are different, with the narrow component having a decrement flatter than the broad component. It thus appears that the narrow component of the Balmer lines seen during the SSS/plateau phase may not arise from the same region as the broad component. The He II lines and the narrow component of the hydrogen lines could both arise in the same region, that is probably ahead of the nova ejecta. Diaz et al. (2010) suggest the narrow lines originate either in the reionised circumbinary material from previous outbursts, or due to chromospheric emission from X-ray illumination of the companion by the shrinking nova photosphere. It is also quite likely that the narrow emission lines arise in the optically thick SSS wind (Hachisu et al. 2000). Mason et al. (2012) suggest the helium lines could be formed in the accretion flow/disc within the binary. The spectra presented in this work indicate that the He II 4686 Å line emerged around the same time as disc reformation. However, we do not find any indications of orbital flux variation in the He II 4686 Å line (see Fig. 5). It is hence important to resolve these issues before any conclusion can be drawn on helium over abundance, or otherwise.
Flares with a duration of ~1 h, and an amplitude of ~0.1–0.5 mag were reported during the early decline phases. These were first noted by Worters et al. (2010). The first such flare was recorded on February 3.86, day + 6, and continued until day + 15. The origin of these flares is unclear (Schaefer et al. 2011). The spectrum of February 4.016, day + 6.83, presented here shows a sharp absorption component at −500 km s-1 in the He I lines, and in the N I and Ca II (+ hydrogen Paschen) lines beyond 8000 Å (see Figs. 8 and 9). This velocity is very similar to the width of the narrow emission lines seen during the SSS/plateau phase. Significant increases in the brightness in the X-rays around phases 0.9 and 1.2 have been reported by Ness et al. (2012). While some extra emission is seen in the N VI 29.1 Å intercombination line during the flare at phase 1.2, lower-temperature nitrogen lines are present, contemporaneous with both flare-like events. Further, the nitrogen lines are found to be unaffected by the X-ray eclipses, leading Ness et al. to suggest that all the plasma emitting the observed N lines resides outside the binary orbit, while the flare-like events could be high temperature events similar to solar flares, and occuring close to the central hot component. Our observations of a sharp absorption component associated with the N (and other) lines support this explanation.
No radio emission was detected from U Sco. The only other recurrent nova outburst that has been detected in the radio is that of RS Ophiuchi, a system that is very different from U Sco. A non-thermal component was detected in the low frequency radio regime during the 2006 outburst (Kantharia et al. 2007; Eyres et al. 2009) arising from the interaction of the nova ejecta with the pre-outburst circumbinary material. Comparing with the observed peak flux density of ~50 mJy detected for RS Oph, it is easily seen that even if U Sco was as bright as RS Oph, the greater distance (12 kpc compared to 1.6 kpc) would suggest a peak flux density of only 0.9 mJy. This is not much more than the 0.3 mJy upper limit found here. However, U Sco is not expected to be as bright as RS Oph since, although evolved, the secondary is a sub-giant and hence, presumably, does not have as dense a wind with which the high velocity ejecta can interact, as from the M giant secondary of RS Oph.
8. Summary
A detailed spectral evolution of the 2010 outburst of the recurrent nova U Sco is presented. While the evolution is generally similar to the previous outbursts, the dense temporal coverage, especially during the early phases reveals several short term variations not reported previously.
The early phase emission line widths indicate extremely high velocities for the nova ejecta, ~10 000 km s-1. The line profiles are broad, boxy and structured.
The spectra reveal short term variations not reported earlier. Narrow P-Cygni absorptions, at ~500 km s-1 are seen associated with the He I lines and also the Ca II, N I and hydrogen lines in the NIR region in the spectrum of day 6.83, obtained immediately after an optical flare. This absorption component could be arising in the plasma emitting the Nitrogen lines seen in X-rays, that probably lies outside the binary orbit.
Rapid variations are detected in the 4660 Å N III feature which shows a significant increase in the line strength on days 8.83 and 13.82, at orbital phases of 0.75 and 0.25, respectively. These are most likely associated with the reforming accretion disc/stream.
Instrinsic linear polarisation is detected around the onset, and during the SSS phase, due to scattering from the disc and jets.
No radio emission is detected in the 1280 MHz and 610 MHz bands.
IRAF is distributed by the National Optical Astronomy Observatory, which is operated by the Association of Universities for Research in Astronomy, Inc., under cooperative agreement with the National Science Foundation.
AIPS is distributed by NRAO which is a facility of the NSF operated under cooperative agreement by Associated Universities, Inc.
Acknowledgments
We thank the referee for a critical reading of the manuscript. We thank all the users of the 2 m-HCT at the Indian Astronomical Observatory (IAO) and the 2 m-IGO telescope at the IUCAA Ghirawali Observatory (IGO), and the respective TACs for their support towards the ToO observations of U Sco. The IAO is operated by the Indian Institute of Astrophysics, Bangalore and the IGO is operated by the Inter-University Centre for Astronomy and Astrophysics (IUCAA), Pune. We thank the Director, NCRA and the GTAC for the GMRT ToO observations. GMRT is operated by the National Centre for Radio Astrophysics, Tata Institute of Fundamental Research, Pune.
References
- Anupama, G. C. 2008, ASP Conf. Ser., 401, 31 [NASA ADS] [Google Scholar]
- Anupama, G. C., & Dewangan, G. C. 2000, AJ, 119, 1359 [NASA ADS] [CrossRef] [Google Scholar]
- Banerjee, D. P. K., Das, R. K., Ashok, N. M., et al. 2010, MNRAS, 408, L71 [NASA ADS] [CrossRef] [Google Scholar]
- Barlow, M. J., Brodie, J. P., Brunt, C. C., et al. 1981, MNRAS, 195, 61 [NASA ADS] [CrossRef] [Google Scholar]
- Bode, M. F., Kochanek, C. S., Stern, D., et al. 2010, ATel, 2392, 1 [NASA ADS] [Google Scholar]
- Diaz, M. P., Williams, R. E., Luna, G. J., Moraes, M., & Takeda, L. 2010, AJ, 140, 1860 [NASA ADS] [CrossRef] [Google Scholar]
- Drake, J. J., & Orlando, S. 2010, ApJ, 720, L195 [NASA ADS] [CrossRef] [Google Scholar]
- Evans, A., Krautter, J., Vanzi, L., & Starrfield, S. 2001, A&A, 378, 132 [NASA ADS] [CrossRef] [EDP Sciences] [Google Scholar]
- Evans, A., Yudin, R. V., Naylor, T., Ringwald, F. A., & Koch Miramond, L. 2002, A&A, 384, 504 [NASA ADS] [CrossRef] [EDP Sciences] [Google Scholar]
- Eyres, S. P. S., O’Brien, T. J., Beswick, R., et al. 2009, MNRAS, 395, 1533 [NASA ADS] [CrossRef] [Google Scholar]
- Gehrz, R. D. 2008, in Classical Novae, Chapter 8, eds. M. F. Bode, & A. Evans, 2nd edn. (Cambridge University Press), 167 [Google Scholar]
- Gupta, R., Burse, M., Das, H. K., et al. 2002, BASI, 30, 785 [NASA ADS] [Google Scholar]
- Hachisu, I., Kato, M., Kato, T., & Matsumoto, K. 2000, ApJ, 528, L97 [NASA ADS] [CrossRef] [PubMed] [Google Scholar]
- Hanes, D. A. 1985, MNRAS, 213, 443 [NASA ADS] [CrossRef] [Google Scholar]
- Hounsell, R., Darnley, M. J., Bode, M. F., et al. 2011, A&A, 530, A81 [NASA ADS] [CrossRef] [EDP Sciences] [Google Scholar]
- Iijima, T. 2002, A&A, 387, 1013 [NASA ADS] [CrossRef] [EDP Sciences] [Google Scholar]
- Ikeda, Y., Kawabata, K. S., & Akitaya, H. 2000, A&A, 355, 256 [NASA ADS] [Google Scholar]
- Kafka, S., & Williams, R. 2011, A&A, 526, A83 [NASA ADS] [CrossRef] [EDP Sciences] [Google Scholar]
- Kahabka, P., Hartmann, H. W., Parmar, A. N., & Negueruela, I. 1999, A&A, 347, L43 [NASA ADS] [Google Scholar]
- Kamath, U. S., Anupama, G. C., Ashok, N. M., Mayya, Y. D., & Sahu, D. K. 2005, MNRAS, 361, 1165 [NASA ADS] [CrossRef] [Google Scholar]
- Kantharia, N. G., Anupama, G. C., Prabhu, T. P., et al. 2007, ApJ, 667, L171 [NASA ADS] [CrossRef] [Google Scholar]
- Kato, M. 1991, ApJ, 369, 471 [NASA ADS] [CrossRef] [Google Scholar]
- Kato, M. 2002, ASP Conf. Ser., 261, 627 [NASA ADS] [Google Scholar]
- Kato, M., & Hachisu, I. 2012, BASI, 40, 393 [Google Scholar]
- Lepine, S., Shara, M. M., Livio, M., & Zurek, D. 1999, ApJ, 522, L121 [NASA ADS] [CrossRef] [Google Scholar]
- Mason, E. 2011, A&A, 532, L11 [NASA ADS] [CrossRef] [EDP Sciences] [Google Scholar]
- Mason, E., Ederoclite, A., Williams, R.E., Della Valle, M., & Setiawan, J. 2012, A&A, 544, A149 [NASA ADS] [CrossRef] [EDP Sciences] [Google Scholar]
- Maxwell, M.P., Rushton, M.T., Darnley, M.J., et al. 2012, MNRAS, 419, 1465 [NASA ADS] [CrossRef] [Google Scholar]
- Munari, U., & Zwittter, T. 1997, A&A, 318, 269 [NASA ADS] [Google Scholar]
- Munari, U., Zwitter, T., Tomov, T., et al. 1999, A&A, 347, L39 [NASA ADS] [Google Scholar]
- Munari, U., Dallaporta, S., & Castellani, F. 2010, IBVS, 5930 [Google Scholar]
- Munari, U., Ribeiro, V. A. R. M., Bode, M. F., & Saguner, T. 2011, MNRAS, 410, 525 [NASA ADS] [CrossRef] [Google Scholar]
- Ness, J.-U., Schaefer, B. E., Dobrotka, A., et al. 2012, ApJ, 745, 43 [Google Scholar]
- Orio, M., Behar, E., Gallagher, J., et al. 2013, MNRAS, 429, 1342 [NASA ADS] [CrossRef] [Google Scholar]
- Pagnotta, A., Schaefer, B. E., Handler, G., et al. 2010, ATel, 2507, 1 [NASA ADS] [Google Scholar]
- Payne-Gaposchkin, C. 1957, The galactic novae (Amsterdam: North-Holland Pub. Co.; New York: Interscience Publishers) [Google Scholar]
- Ribeiro, V. A. R. M. 2011, Ph.D. Thesis, Liverpool JMU [Google Scholar]
- Rosino, L., & Iijima, T. 1988, A&A, 201, 89 [NASA ADS] [Google Scholar]
- Schaefer, B. E. 2005, ApJ, 621, L53 [NASA ADS] [CrossRef] [Google Scholar]
- Schaefer, B. E. 2010, ApJS, 187, 275 [NASA ADS] [CrossRef] [Google Scholar]
- Schaefer, B. E. 2011, ApJ, 742, 112 [NASA ADS] [CrossRef] [Google Scholar]
- Schaefer, B. E., & Ringwald, F. A. 1995, ApJ, 447, L45 [NASA ADS] [CrossRef] [Google Scholar]
- Schaefer, B. E., Harris, B. G., Dvorak, S., Templeton, M., & Linnolt, M. 2010a, IAUC, 9111, 1 [NASA ADS] [Google Scholar]
- Schaefer, B. E., Pagnotta, A., Xiao, L., et al. 2010b, AJ, 140, 925 [NASA ADS] [CrossRef] [Google Scholar]
- Schaefer, B. E., Pagnotta, A., Osborne, J. P., et al. 2010c, ATel, 2477, 1 [NASA ADS] [Google Scholar]
- Schaefer, B. E., Pagnotta, A., LaCluyze, A. P., et al. 2011, ApJ, 742, 113 [NASA ADS] [CrossRef] [Google Scholar]
- Schlegel, E. M., Schaefer, B., Pagnotta, A., et al. 2010, ATel, 2430, 1 [NASA ADS] [Google Scholar]
- Schmidt, G. D., Elston, R., & Lupie, O. L. 1992, AJ, 104, 1563 [NASA ADS] [CrossRef] [Google Scholar]
- Sekiguchi, K., Feast, M. W., Whitelock, P. A., et al. 1988, MNRAS, 234, 281 [NASA ADS] [CrossRef] [Google Scholar]
- Serkowski, K., Mathewson, D. S., & Ford, V. L. 1975, ApJ, 196, 261 [NASA ADS] [CrossRef] [Google Scholar]
- Shaw, R. A., & Dufour, R. J. 1995, PASP, 107, 896 [NASA ADS] [CrossRef] [Google Scholar]
- Shore, S. N., Schwarz, G. J., De Gennaro Aquino, I., et al. 2013, A&A, 549, A140 [NASA ADS] [CrossRef] [EDP Sciences] [Google Scholar]
- Starrfield, S., Sparks, W. M., & Truran, J. W. 1985, ApJ, 291, 136 [NASA ADS] [CrossRef] [Google Scholar]
- Starrfield, S., Iliadis, C., Timmes, F. X., et al. 2012, BASI, 40, 419 [NASA ADS] [Google Scholar]
- Storey, P. J., & Hummer, D. G. 1995, MNRAS, 272, 41 [NASA ADS] [CrossRef] [Google Scholar]
- Thoroughgood, T. D., Dhillon, P. V. S., Littlefair, S. P., Marsh, T. R., & Smith, D. A. 2001, MNRAS, 327, 1323 [NASA ADS] [CrossRef] [Google Scholar]
- Williams, R. E. 2012, AJ, 144, 28 [Google Scholar]
- Williams, R. E., Sparks, W. M., Gallagher, J. S., et al. 1981, ApJ, 251, 221 [NASA ADS] [CrossRef] [Google Scholar]
- Worters, H. L., Eyres, S. P. S., Rushton, M. T., & Schaefer, B. 2010, IAUC, 9114, 1 [NASA ADS] [Google Scholar]
- Yamanaka, M., Uemura, M., Kawabata, K. S., et al. 2010, PASJ, 62, L37 [NASA ADS] [Google Scholar]
All Tables
Line identifications and observed fluxes (in units of 10-12 erg/cm2/s) during the early phase.
Line identifications and observed fluxes (in units of 10-12 erg/cm2/s) during the SSS phase.
Line identifications and observed fluxes (in units of 10-13 erg/cm2/s) during the nebular phase.
All Figures
|
Fig. 1 Observed linear polarisation measurements (top panel) and position angle (bottom panel) in U Sco. Note the increase in the polarisation values, and also a change in the position angle. |
| In the text | |
|
Fig. 2 Optical spectra of U Sco during days 0.83–3.83 after outburst maximum. The emission line identifications and day since the estimated maximum are marked. Note the changes in the line profile. For clarity, the zero level of the spectra of days 0.831, 1.825 and 2.821 are offset, respectively, by a constant value of 0.8, 0.5 and 0.3 in flux units. |
| In the text | |
|
Fig. 3 Optical spectra of U Sco during days 4.81–9.83 after outburst maximum. The time since estimated maximum and emission line identifications are marked. Note the changes in the line profile, and the decrease in the strength of the oxygen and nitrogen lines by day ~7. For clarity, the zero level of the spectra of days 4.805, 5.806, 6.826, 7.827 and 8.826 are offset, respectively, by a constant value of 1.6, 1.3, 1.0, 0.7 and 0.3 in flux units. |
| In the text | |
|
Fig. 4 Spectrum of U Sco during days 6.8–16.8 after outburst maximum, showing the emergence and increase in the strength of the He II lines. Note also the relative increase in the strength of the N III 4660 feature on days 8.83 and 13.82. |
| In the text | |
|
Fig. 5 Top panel: He II 4686 Å flux as a function of outburst phase. Note the sudden increase in the flux just before the onset of the SSS phase, and an almost constant flux during and after the SSS phase. Bottom panel: He II 4686 Å flux as a function of the orbital phase. No significant orbital phase dependence is seen. |
| In the text | |
|
Fig. 6 Optical spectra of U Sco during the SSS phase. The time since maximum is marked against the spectrum. Note the general decrease in the emission line strengths. For clarity, the zero level of the spectra of days 20.822, 21.812, 22.182 and 23.805 are offset, respectively, by a constant value of 1.5, 1.1, 0.8 and 0.5 in flux units. |
| In the text | |
|
Fig. 7 Optical spectra of U Sco during days 33.78–50.80 after outburst maximum. Note the increase in the strength of the nebular lines, and also the increase in the line width of the Hα line after day 33.78. |
| In the text | |
|
Fig. 8 He I 5876 Å and 7065 Å line profiles during +5.81d – +8.83d. Note the sharp dip around −500 km s-1 on days +6.83 and +7.83 |
| In the text | |
|
Fig. 9 Spectrum of U Sco during +5.81d – +7.83d in the 8200–9000 Å region, showing the sharp, blue shifted absorption associated with the N I, Ca II and hydrogen Paschen lines on day +6.83. |
| In the text | |
|
Fig. 10 Quiescence spectrum of U Sco in April 2006 and May 2009. The orbital phases corresponding to the epoch of the spectra are indicated. Also plotted for comparison are the standard spectra of K and G stars (bottom panel). |
| In the text | |
Current usage metrics show cumulative count of Article Views (full-text article views including HTML views, PDF and ePub downloads, according to the available data) and Abstracts Views on Vision4Press platform.
Data correspond to usage on the plateform after 2015. The current usage metrics is available 48-96 hours after online publication and is updated daily on week days.
Initial download of the metrics may take a while.