Fig. 6
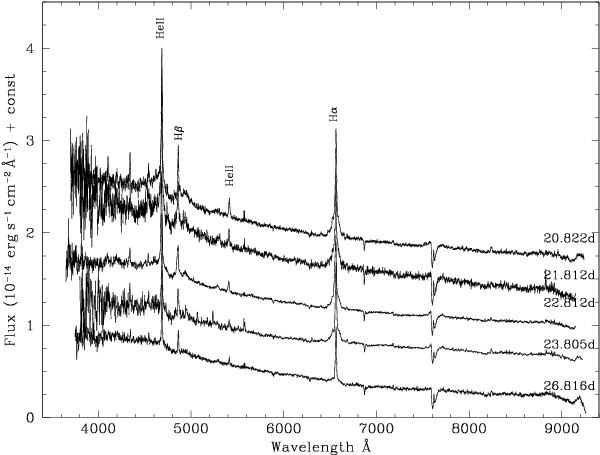
Optical spectra of U Sco during the SSS phase. The time since maximum is marked against the spectrum. Note the general decrease in the emission line strengths. For clarity, the zero level of the spectra of days 20.822, 21.812, 22.182 and 23.805 are offset, respectively, by a constant value of 1.5, 1.1, 0.8 and 0.5 in flux units.
Current usage metrics show cumulative count of Article Views (full-text article views including HTML views, PDF and ePub downloads, according to the available data) and Abstracts Views on Vision4Press platform.
Data correspond to usage on the plateform after 2015. The current usage metrics is available 48-96 hours after online publication and is updated daily on week days.
Initial download of the metrics may take a while.