Free Access
Fig. 3
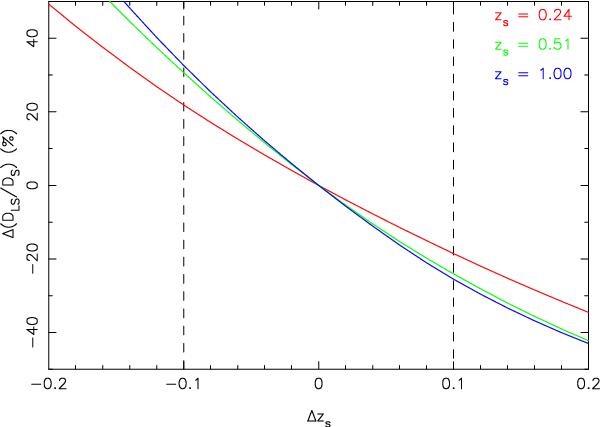
Variation in the average geometrical factor ⟨ Dls/Ds ⟩ as a function of the shift around the true lens redshift for three groups, SA48 (red curve), SA50 (green curve), and SA123 (blue curve). The two vertical dashed lines mark the typical ± 0.1uncertainty of photometric redshifts.
Current usage metrics show cumulative count of Article Views (full-text article views including HTML views, PDF and ePub downloads, according to the available data) and Abstracts Views on Vision4Press platform.
Data correspond to usage on the plateform after 2015. The current usage metrics is available 48-96 hours after online publication and is updated daily on week days.
Initial download of the metrics may take a while.