Fig. A.1
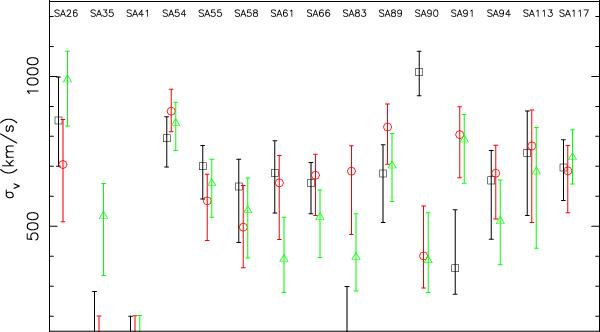
SIS model on the multi-modal SARCS candidates. The centre chosen for the shear profile is located either on the strong-lensing system (black open squares), at the middle of the 2 luminosity over-densities (red open circles) or on the luminosity peak not associated to the strong lensing features (green open triangles). The measured dispersion at the three different positionings can be used as an indicator of the dominance of the strong lens within its group.
Current usage metrics show cumulative count of Article Views (full-text article views including HTML views, PDF and ePub downloads, according to the available data) and Abstracts Views on Vision4Press platform.
Data correspond to usage on the plateform after 2015. The current usage metrics is available 48-96 hours after online publication and is updated daily on week days.
Initial download of the metrics may take a while.