Fig. 11
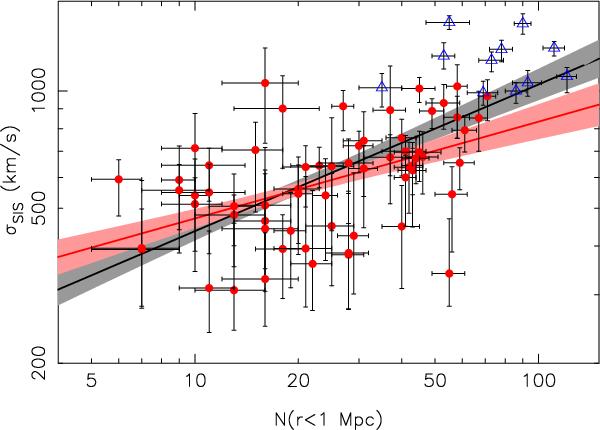
Richness-velocity dispersion scaling relation. The black solid line shows the best BCES orthogonal fit of the N1 Mpc − σSIS relation using the SARCS most secure candidates (red points) and adding the EXCPRES galaxy clusters of Foëx et al. (2012) (blue open triangles). The grey shaded area gives the statistical 1σ uncertainty given by the best fit parameters (statistical dispersion σstat). The red line (and corresponding shaded area) is the best fit using only the SARCS most secure candidates.
Current usage metrics show cumulative count of Article Views (full-text article views including HTML views, PDF and ePub downloads, according to the available data) and Abstracts Views on Vision4Press platform.
Data correspond to usage on the plateform after 2015. The current usage metrics is available 48-96 hours after online publication and is updated daily on week days.
Initial download of the metrics may take a while.