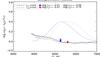
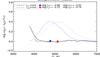
Fig. B.2
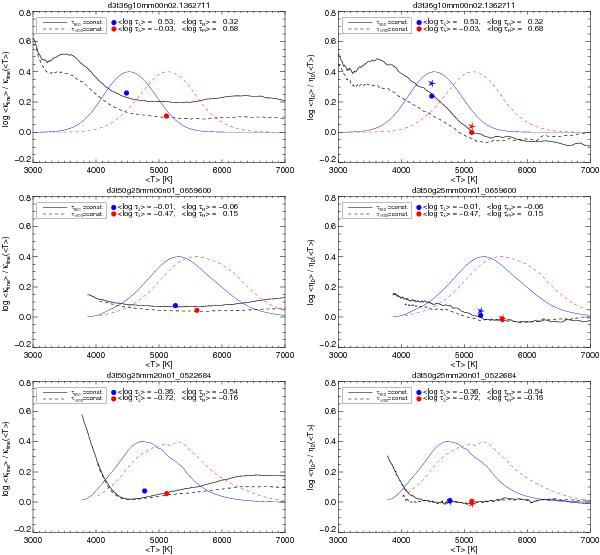
Depth dependence of amplification factors
 (left column) and
  (right column) of Fe ii, χ = 6 eV,
at λ 850 (solid) and 1600 nm (dashed) for the three red giant
models of Table B.1 (top to
bottom). The weighting function
ℬ2,2,2 for both wavelengths is
also shown (solid blue and dashed red lines). Filled circles are centered at
⟨ T ⟩ line and indicate the resulting effective
amplification factors log ℛ2,3,2
(left panels) and
log ℛ2,3,3 (right
panels). Star symbols indicate the values of
log ℛ3,3,3 (right
panels).
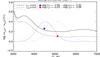
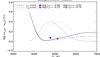
(right column) of Fe ii, χ = 6 eV,
at λ 850 (solid) and 1600 nm (dashed) for the three red giant
models of Table B.1 (top to
bottom). The weighting function
ℬ2,2,2 for both wavelengths is
also shown (solid blue and dashed red lines). Filled circles are centered at
⟨ T ⟩ line and indicate the resulting effective
amplification factors log ℛ2,3,2
(left panels) and
log ℛ2,3,3 (right
panels). Star symbols indicate the values of
log ℛ3,3,3 (right
panels).
Current usage metrics show cumulative count of Article Views (full-text article views including HTML views, PDF and ePub downloads, according to the available data) and Abstracts Views on Vision4Press platform.
Data correspond to usage on the plateform after 2015. The current usage metrics is available 48-96 hours after online publication and is updated daily on week days.
Initial download of the metrics may take a while.