Fig. B.1
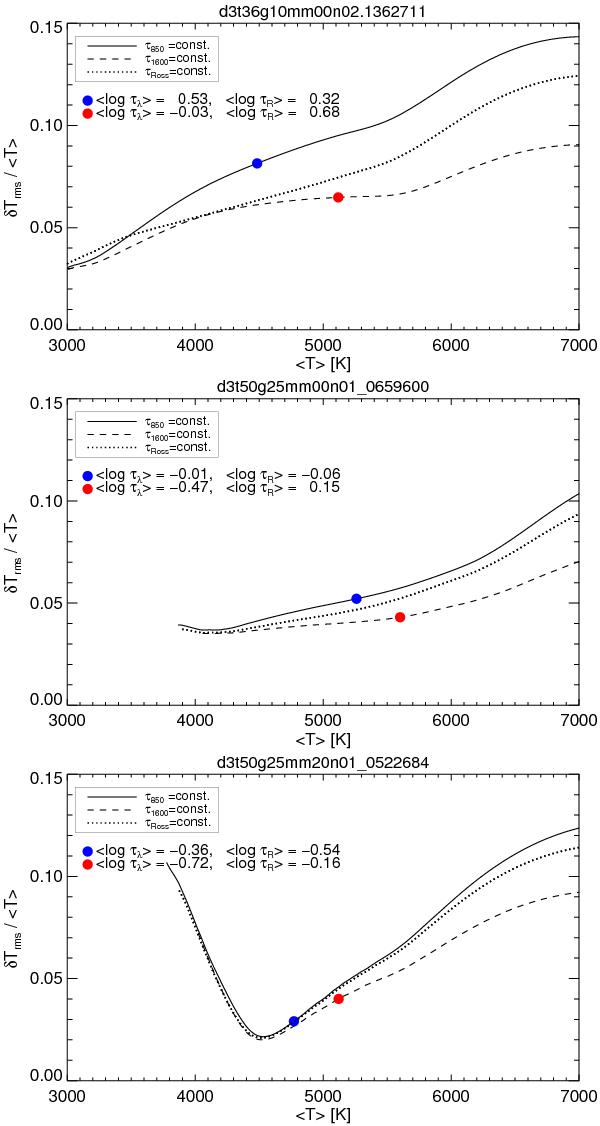
Amplitude of the relative rms temperature fluctuations δTrms/ ⟨ T ⟩ versus the average temperature ⟨ T ⟩, evaluated on different iso-optical depth surfaces: τ850 (solid), τ1600 (dashed), τRoss (dotted). Filled circles indicate the values at the mean height of line formation at λ 850 nm and λ 1600 nm, respectively, as given in Table B.1.
Current usage metrics show cumulative count of Article Views (full-text article views including HTML views, PDF and ePub downloads, according to the available data) and Abstracts Views on Vision4Press platform.
Data correspond to usage on the plateform after 2015. The current usage metrics is available 48-96 hours after online publication and is updated daily on week days.
Initial download of the metrics may take a while.