Fig. 2
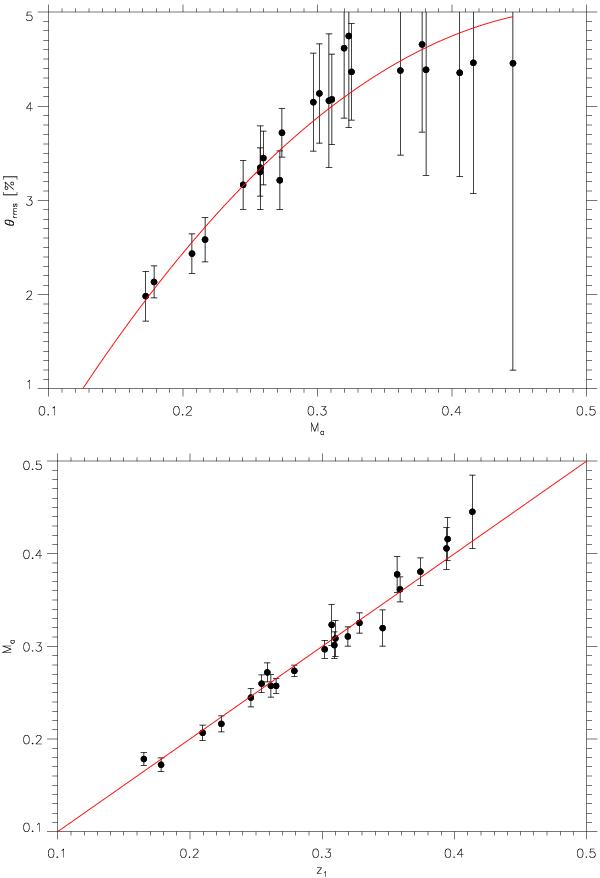
Top: relative temperature fluctuation Θrms (in %) as a function of the Mach number ℳa. The filled circles correspond to the values obtained for each 3D model (see Table 1). Theses values were computed at the photosphere (i.e. at the optical depth τ = 2/3). The red curve corresponds to the polynomial function given by Eq. (12). The two upper points that deviate most from the polynomial function correspond to the two 3D models with log g ≤ 2, i.e. the most evolved RG 3D models of our grid. Bottom: ℳa as a function of the quantity z1 given by Eq. (17). The red line corresponds to a linear scaling in z1.
Current usage metrics show cumulative count of Article Views (full-text article views including HTML views, PDF and ePub downloads, according to the available data) and Abstracts Views on Vision4Press platform.
Data correspond to usage on the plateform after 2015. The current usage metrics is available 48-96 hours after online publication and is updated daily on week days.
Initial download of the metrics may take a while.