Fig. 1
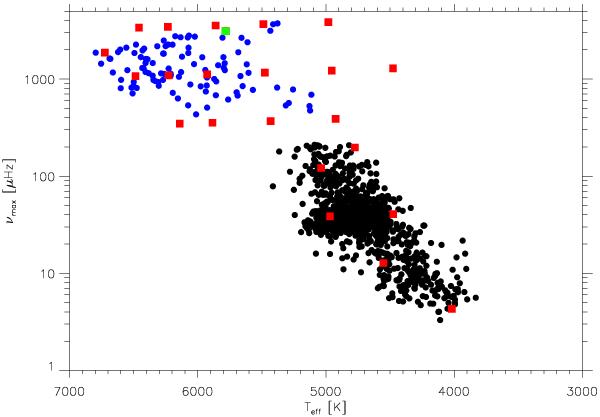
νmax as a function of Teff. The filled red squares correspond to the location of the 3D hydrodynamical models in the plan νmax − Teff (see also Table 1), the filled blue circles to the Kepler sub-giant and MS targets, and the black ones to the Kepler red giants (see Sect. 5). The filled green square shows the position of our 3D solar model (the last model in Table 1).
Current usage metrics show cumulative count of Article Views (full-text article views including HTML views, PDF and ePub downloads, according to the available data) and Abstracts Views on Vision4Press platform.
Data correspond to usage on the plateform after 2015. The current usage metrics is available 48-96 hours after online publication and is updated daily on week days.
Initial download of the metrics may take a while.