| Issue |
A&A
Volume 559, November 2013
|
|
|---|---|---|
| Article Number | A8 | |
| Number of page(s) | 13 | |
| Section | Extragalactic astronomy | |
| DOI | https://doi.org/10.1051/0004-6361/201219721 | |
| Published online | 28 October 2013 | |
Broad-band photometry and long-slit spectroscopy of the peculiar ring galaxy FM 287-14⋆
1 MCTI/Laboratório Nacional de Astrofísica, Rua Estados Unidos 154, CEP 37504-364 Itajubá, MG, Brazil
e-mail: This email address is being protected from spambots. You need JavaScript enabled to view it.
; This email address is being protected from spambots. You need JavaScript enabled to view it.
; This email address is being protected from spambots. You need JavaScript enabled to view it.
2 UEFS, Departamento de Física, Av. Transnordenstina, S/N, Novo Horizonte, CEP 44036-900 Feira de Santana, BA, Brazil
3 UEFS, Observatório Astronômico Antares, Rua da Barra, 925, Jardim Cruzeiro, CEP 44015-430 Feira de Santana, BA, Brazil
e-mail: This email address is being protected from spambots. You need JavaScript enabled to view it.
; This email address is being protected from spambots. You need JavaScript enabled to view it.
; This email address is being protected from spambots. You need JavaScript enabled to view it.
4 Gemini Observatory, Southern Operations Center, c/o AURA, 603 Casilla, La Serena, Chile
e-mail: This email address is being protected from spambots. You need JavaScript enabled to view it.
5 UNIFEI, Instituto de Engenharia de Produção e Gestão, Av. BPS, 1303, Pinheirinho, CEP 37500-903 Itajubá, MG, Brazil
Received: 30 May 2013
Accepted: 21 August 2013
Abstract
Aims. We report detailed morphological and kinematical insights into the disturbed galaxy FM 287-14, which is reported in the literature as a member of strongly interacting galaxies with a clear case of mergers. The main purpose of this paper is to provide a first observational study of this double-nuclei object based on photometry and spectroscopy.
Methods. The study is based on BVR photometry with the 1.6-m telescope at OPD, and long-slit spectroscopy with Gemini South’s GMOS spectrograph, with two-gratings centered at 5 011 Å and 6 765 Å. Image enhancement techniques were applied to the direct images, and the main lines in the spectra were used to determine the radial velocity. Line ratios and color-color diagnostic diagrams helped determine the nature of this object.
Results. The external NE section is populated with well-defined H ii regions and is bluer than the SW region with less evidence of H ii regions. A double nucleus has been identified. The (B − R) × (B − V) diagram shows that the main nucleus is redder than the second one; the internal “ring-like” structure is redder than the external one. The main object redshift is z = 0.0311, corresponding to a line-of-sight velocity of 9334 km s-1 (a distance of 133.3 Mpc), and the second nucleus has a redshift of z = 0.0310, corresponding to a line-of-sight velocity of 9300 km s-1 (a distance of 132.9 Mpc). Both nuclei show characteristics of early-type galaxies, but the main one also shows modest emission evidence of the [N ii]λ6583 line.
Conclusions. The peculiarities of FM 287-14 can be adequately interpreted as an ongoing merging-stage of interaction of the main object with a companion galaxy.
Key words: Galaxies: interactions / Galaxies: general / Galaxies: individual: FM 287-14 / Galaxies: peculiar / Galaxies: kinematics and dynamics
Based on observations carried out at Observatório do Pico dos Dias (OPD), which is operated by LNA/MCTI, Brazil, and at the Gemini South Telescope, program ID: GS-2006A-DD-11.
© ESO, 2013
1. Introduction
According to Toomre & Toomre (1972), collisional disruption, together with gas dissipation, could feed all kinds of nuclear activity, and it has inspired many searches for a connection between galaxy interactions and active galactic nuclei (AGN). There are many observational examples that show that tidal interaction between galaxies plays a key rôle in triggering galactic nuclear activity, both nuclear starburst and AGN activities (e.g. Zou et al. 1995; Sánchez et al. 2005; Smirnova et al.. 2006; Alonso et al. 2007; Li et al. 2008a, 2008b; Ellison et al. 2008). Other mechanisms for the fueling of AGN are the presence of more than one supermassive black hole (Begelman et al. 1980) and the disk of barred galaxies generated by internal instabilities (Shlosman et al. 1990).
 |
Fig. 1 2.′2 × 1.′8 V-band image of FM 287-14. Top: the huge visible halo. shells and a tidal filament, enhanced by a 500-pixel2 median kernel filtering of the original image. Bottom: the same image in a different contrast: (1) the bulge and the central region; (2) a ring-like structure surrounding the bulge; and (3) a partial outer ring spreading to the N direction, which may be the locus of intense star formation within an underlying gaseous disk. See Table 5 for photometric measurements of the numbered regions. |
 |
Fig. 2 R-band image, where the double nuclei can be seen. Both panels show both nuclei with different contrasts to highlight their main morphological features. The PA slit positions are displayed in the first panel. The dashed circles show the position of the two H ii regions encompassed by both slits reported in this work. |
In some interacting systems, the presence of dramatic morphological, kinematic, and spectroscopic signatures, including tidal tails and streams, distorted structures, extreme infrared emission, and starbursts, indicate the effects of tidal forces. Simkin et al. (1980) studied nearby Seyfert galaxies, which contain low-luminosity AGNs and found asymmetries and/or morphological disturbances in many of the host galaxies. They suggested that asymmetries probably resulted either from internal causes like bars or from tidal interactions. In addition, subsequent studies have suggested that most Seyfert galaxies (mainly those with relatively high nuclear luminosities) have experienced tidal interactions in the recent past (Kuo et al. 2008; Tang et al. 2008).
Galaxies that show interaction and tidal effects, like the peculiar ring galaxies (pRG), which show a wide variety of ring and bulge morphologies, are the subject of our study. These pRG were classified by Faúndez-Abans & de Oliveira-Abans (1998a, FAOA hereafter) into five families, following the general behavior of the galaxy-ring structure. We have selected FM 287-14 (alternative names ESO 287-G40, AM 2134-471, and 2MASX J21372818-4702090) from the list of FAOA. The more detailed the study of a particular galaxy is, the more information and features of various kinds that are indicative of its preceding evolution are detected. Figure 1 presents an image of FM 287-14 in the V-band in two different contrasts, and Table 1 displays a summary of the properties of the galaxy including the new results from this work. This galaxy does not have nearby neighbors with comparable luminosity, but there are the close galaxies APMUKS(BJ) B213405.63-471625.4 on the SW and the spheroidal galaxy 2MASX J21373607-4702392 on the SE. Therefore, the most probable cause for the formation of the asymmetric morphological features and star formation regions on the ring may be the tidal disruption of a near low-mass companion.
In this paper, we report the results of observations carried out at Observatório do Pico dos Dias (OPD) with BVR photometry and Gemini Multi-Object Spectrograph (GMOS), with long-slit spectroscopy, to investigate the morphological and physical properties of this peculiar galaxy which show at least two off-center rings and a possibly double nucleus. The Figs. 1 and 2 show the optical direct CCD image taken at OPD using the BVR Kron-Cousins filters at the 1.6-m telescope. The GMOS long-slit spectra were taken at two different position angles on the sky: PA = 113° and PA = 253° (to encompass the two nuclei), as closely aligned as possible to the major and minor axes, respectively. A value of Ho = 70 km s-1 Mpc-1, Ωmatter = 0.27, and Ωvaccum = 0.73 have been adopted throughout this work (Freedman et al. 2001).
This paper is organized as follows. The observations and procedures used to reduce the data are described in Sect. 2; analysis and results, in Sect. 3; the discussion and conclusions are summarized in Sect. 4.
This work’s estimates and general properties of FM 287-14.
2. Observations and data reduction
2.1. Broad-band photometry
Photometric data was obtained with the 1.6-m telescope at OPD, equipped with the direct-imaging camera #11, with BVR Kron-Cousins filters (Bessel 1990) and a 384 × 578-pixel chip with a scale of 0.284″ pixel-1 (0.128 kpc pixel-1 and 0.451 kpc arcsec-1). The readout noise was 11.5e− and the gain 10.05e−/ADU. Three frames in each filter with individual exposure times of 600 s were taken under 1 5 FWHM seeing, with a mean airmass of 1.11. Table 2 displays the journal of the photometric observations. Standard stars from Landolt (1992) at a similar airmass were used for extinction and calibration purposes throughout the night.
Details of the OPD photometric observations.
The CCD image processing and data analysis were done with standard procedures, using the IRAF2 and STSDAS packages. All frames were inspected and statistically examined, then trimmed manually. The bias and quartz-lamp flats were removed using CCDPROC without overscan or trimming. Each image has a linear spatial dithering ≤2 pix and a negligible angular one. The frames were aligned using four isolated stars in each frame using IMALIGN, then collapsed for each filter using IMCOMBINE, which also allows a first removal of the cosmic rays. A further run of IRAF COSMIC RAY task allowed final cleaning. Almost 22 photometric standard stars from Landolt (1992) were observed and the calibration to the standard BVR photometric system was performed following Reshetnikov et al. (1994) and Myrrha et al. (1999). The standard deviation σ, in the calibration of the BVR filters are 0.058, 0.035, and 0.043 mag, respectively. The sky brightness, in mag arcsec-2 are 21.72, 20.54, and 19.84. The aperture photometry, PSF, and FWHM were determined from DIGIPHOT APPHOT; the photometry aperture radius was four times the size of the FWHM to ensure that as much light as possible was measured. The PSF was determined based on 14 isolated stars in each frame. The observed field lacks from a reasonably large number of bright stars to perform this calculation better.
The sky background was estimated by two different approaches: (a) by examining the median count level in concentric rings of different widths centered on the galaxy with the external radius extending to the limits of the frame within at least four times the visual radius of FM 287-14, and then estimating the lowest intensity level; (b) by fitting the sky background with a bidimensional third-order spline in selected areas of the frame and comparing its results of the lowest intensity level with the first approach. Not all of the foreground bright stars were completely removed by the PSF; the residuals can be seen as blemishes in the top panel of Fig. 1. Those objects were not taken into account in the calculation of the sky fitting surface by the use of rectangular masks. The standard deviation intensity uncertainty of the background level was then 1.0%–1.2%. The removal of foreground stars was achieved with IRAF PEAK SUBSTAR. The integrated photometry was performed with the IRAF ELLIPSE and IRAF POLYPHOT.
For the sake of further exploration of the surface brightness distribution, we also used the Gemini pointing GMOS r-band image, with the second nucleus masked. The advantage of this raw image is its better pixel resolution and the low-brightness outskirts are reached.
2.2. Long-slit spectroscopy
The spectroscopic observations were performed with the 8.1-m Gemini South telescope (Chile), program ID: GS-2006A-DD11. We used the GMOS spectrograph in long-slit mode (Hook et al. 2004). Two gratings were used with a long-slit 1.5″ wide by 375″ long: B600+G5323 (600 lines mm-1) and R400+G5325 (400 lines mm-1), centered at 5011 Å and 6765 Å, respectively. For the three CCDs, from 1 to 3, the readout noise was 2, 1.9, and 1.9e− and the gain 3.2, 3.5, and 3.1e−/ADU, respectively. The data were binned by four pixels in the spatial dimension and by two pixels in the spectral dimension producing a spectral resolution of ~5.1 Å (FWHM) sampled at 0.68 Å pixel-1. The seeing throughout the observations was 1.5″, and the binned pixel scale was 0.145″ pixel-1. The wavelength range was ~3500–7000 Å. Table 3 presents the journal of the observations. The spectrophotometric standard star LTT 48163 was observed using the same experimental set up. This star is a tertiary standard from Baldwin & Stone (1984), as revised by Hamuy et al. (1992, see also Hamuy et al. 1994).
The standard Gemini-IRAF routines were used to carry out bias subtraction, flat-fielding, and cosmic ray subtraction. The data were then wavelength-calibrated with an accuracy  0.3 Å. The binned 2D spectra were then flux-calibrated using the photometric standard star LTT 4816. The 2D spectra were then extracted into 1D spectra, which were sky-subtracted and binned in the spatial dimension. A reddening correction of E(B − V) = 0.027 (Schlegel et al. 1998) was applied using the standard IRAF routines. We cross-correlated our observed spectra with three galaxy and star templates with good signal-to-noise ratio (S/N). These results were checked with the composite absorption-line template “fabtemp97” distributed by the RVSAO IRAF external package, version 2.3.1, 2002 (see Kurtz & Mink 1998). We adopted the redshift value from the best highest correlated coefficient template.
Details of the GMOS spectroscopic observations.
3. Analysis and results
3.1. Broad-band photometry
3.1.1. Surface-brigtness distribution
A two-component model for the bulge and disk has been fitted to the average 360° surface brightness profile (Fig. 3) with the help of STSDAS/NFIT1D. The upper panel of Fig. 3 displays the surface brightness distribution and the two-component model of the bulge and disk STSDAS/NFIT1D fitting results. There is some deviation from the r1/4 law. The luminosity profile of FM 287-14 resembles that of Arp 166 at PA = 85°, which belongs to a pair of elliptical interacting galaxies (Madejsky 1991). The lower panel displays the variation in the isophotal ellipticity, which grows continuously from the center to within 12.5″, then decreases to a less elliptical feature. The discontinuity at 20″ lies close to the location of the outer ring. From 20″ to 30″, there is a bump that seems to surround the main object. Beyond 30″ there is the background.
 |
Fig. 3 Upper panel: r-band luminosity profile for FM 287-14. The bulge-fitting function is represented by a continuous line and the disk by the dashed one. Lower panel: ellipticity variation from the center in arcsec. |
Since the real isophotes are not always perfect ellipses, one would like to express non-ellipticity parameters in some suitable manner in order to build a scenario for which interpretation leads to insight into the present and past parts of the object‘s history. This is usually done by means of Fourier harmonics as an approximation to the isophotal surface brightness as a function of the azimutal angle and the average intensity over the ellipse, more specifically, through the third and fourth cosine Fourier coefficients (e.g., Bender et al. 1998). The fourth Fourier cosine coefficient B4 parametrizes the boxyness (B4 < 0) or diskyness (B4 > 0) of the isophotes. Its radial profile is plotted in the upper panel of Fig. 4. The trend suggests the presence of internal structures almost within the outskirts of the galaxy, where the discontinuity at 20″ is evident. The IRAF/STDAS/ELLIPSE task (Busko 1996 based on the work of Jedrzejewski 1987) was run with the non-fixed center option. This free parameter allowed us to build the lower panel of Fig. 4, where discontinuities in the “path” are also evident. Subtracting the ellipsoidal model from the original image produces a patterned image where the finer morphological details (e.g., disks, rings, arcs, plumes) are frequently evident (see Rich et al. 2012).
This curve is less well-behaved than the one for the ellipticity. The discontinuity also happens at r ≈ 20″. This is approximately the distance of the larger and knotty ring on the N. There are a few regions where the isophotes present B4 = 0. From r = 0 to r ≈ 5″, the central part of the galaxy is disky. From r ≈ 5 to 20″, there are a number of features, mainly characterized by B4 < 0, that indicate that the isophotes are boxy, with strong oscillations at 15′′ and 20′′. Beyond the discontinuity, B4 > 0 and the isophotes are disky again, and then elliptical to within the faint sky background.
The lower panel of Fig. 4 is an attempt to visualize the changes in the centers’ coordinates of the model ellipses as we proceed outwards, projected onto the plane of the sky. The sequence of numbers helps us follow their track. By 20″, there is a small increase in the E-W linear coordinate (~1″), while the shift in the N-S one is ≳3″. The centers’ positions are thus confined in the interval region of approximately 8″ along N-S and 9″ along E-W. Comparing this figure with Figs. 3 and 4, we see that all the changes occur in a small region if compared to the extent to which isophotes are fitted (35″). There is nothing unusual with the ellipticity or B4 radial profiles if we take the disturbed morphology of the galaxy into account.
 |
Fig. 4 Upper panel: average radial variation in the B4 coefficient. Lower panel: sequencial locations of the model isophotes’ center coordinates as they are fitted outwards. |
3.1.2. Image enhancement
To extract as much information as possible from the OPD images, we applied the techniques of image enhancement by transform processing described in Faúndez-Abans & de Oliveira-Abans (1998b), with emphasis on the V and R frames due to their better S/N.
FM 287-14 is classified as an (R)SAB(r)bc peculiar galaxy (NASA/IPAC Extragalactic Database − NED). In the top panel of Fig. 1, a residual V-band image is displayed after the subtraction of a 500-pixel2 median kernel-filtered frame from the original image. A well-developed halo viewed almost face-on and very faint external rims, together with a jet-like structure in the SE direction have been enhanced. The small circular structure on this filament is the residual from the subtraction of a bright field star. We carefully applied the subtraction method to the galaxy signal in this region. The bottom panel of the figure shows the V-band image at different contrasts to enhance the star formation regions. It highlights the bulge (surrounding the central region, which happens to have a second nucleus), a ring-like structure surrounding the bulge, and the rest of an outer ring spread to the N direction, which may represent the locus of intense star formation within an underlying gaseous disk. Several structures are observed along the external ring. The presence of these structures are often associated with relatively recent tidal interaction or the merging of a companion (see Schweizer & Seitzer 1992a). The image suggests the existence of partially overlapping shock waves in the original galaxy disk, which triggered the formation of rings. The galaxy-like object on the SE direction is a galaxy. Working in the transform domain, Fig. 5 displays the R-band Fourier hologram enhancing the external ring with its star forming regions, and the several faint signals of the outermost structures. Even though the method introduces artifacts such as some of the dark regions around bright areas, there seems to be extended turbulence owing to the tidal interaction in the halo.
Figure 2 shows the central region of FM 287-14 in the R-band. There seems to be a nuclear-like companion. Clearly, the main nucleus belongs to the geometrical center of FM 287-14 galaxy, but this picture has revealed a secondary component, which has been confirmed by our spectroscopic results in a possible merging process with the main galaxy. This component is indicated by the arrow on the PA = 253° brightness profile of Fig. 6 (SW-NE full line).
Colors indices along different sections of FM 287-14.
 |
Fig. 5 R-band Fourier hologram enhancing the faint signals around the bulge. |
 |
Fig. 6 Brightness profiles extracted from a 0.28′′-aperture width: PA = 253° (SW-NE, full line) and PA = 113° (SE-NW, dashed line). The arrow indicates presence of the second nucleus. |
3.1.3. Color indices
Box apertures of 2 × 2-pixel and 4 × 4-pixel sizes were used for the photometry of the bright and faint regions of the galaxy, respectively. At least ten measurements of one or two pixel shifts were made to improve the statistics. Table 4 displays the colors B − R, B − V, and V − R of candidate H ii regions as measured: (a) on the internal ring, with an rms error of 0.01 mag, and (b) along the filament (“the jet”) with an rms of 0.15 mag. The measurements were performed on both nuclei, using the centering IRAF algorithm along (1) four sections of the internal ring (structure close to the bulge); (2) two of them on the N-E direction and two on the SW direction; (3) seven knots (H ii region’s), where the quoted regions are numbered in the bottom panel of Fig. 1; (4) three regions along the jet-like structure on the E direction; and (5) one control region on the smooth area to the south of FM 287-14.
Figure 7 displays the B − R versus B − V color diagram. The figure suggests that the N-E section of the external ring is populated with well-defined H ii regions, maybe active star-forming clumps (see also the second panel of Fig. 1), being bluer and clumpier than the SW region, which is redder and smoother, without clear evidence of compact H ii regions. Both external rings are evidence of dramatic double triggering of starbursts due to density wave shocks throughout the galactic disk. The internal ring is redder than the external ones, and the main nucleus is redder than the secondary object. The jet shows evidence of young and old population mixtures.
 |
Fig. 7 H ii regions of the external and internal ring. Both nuclei are redder, indicating the presence of an old star population. |
Calibrated emission-line fluxes (see Fig. 9).
Emission-line ratios.
3.2. Kinematics and excitation machanisms
In this section, we analyze the spectra extracted from different gratings and slit positions combinations (see Table 3 and Figs. 9−12). All spectra are corrected for Galactic extinction using the maps of Schlegel et al. (1998), shifted to the rest frame, logarithmically rebinned (as recommended), and resampled to λ = 1 Å between 3400 and 7000 Å. The extinction curves of Cardelli et al. (1989, 2000) are used to make the best estimates of dust reddening. The emission line ratios have been dereddened using the standard extinction law (RV = 3.1) of Cardelli et al. (1989) and adopting an intrinsic Hα/Hβ of 2.86.
3.2.1. Gas and stellar kinematics
The rotation curves along the observed slit positions, i.e., the radial velocity after subtraction of the systemic velocities, Vsys, as determined from the rotation model described below, are presented in Fig. 8, without correction by the inclination in the plane of the sky. However, since the galaxy shows a fairly symmetric rotation curve, we adopted a very simple approximation for the observed velocity distribution, assuming that the stars move under a logarithmic gravitational potential, following circular orbits close to a plane P(i,ψ0) that are characterized by its inclination to the plane of the sky (i) and the position angle (PA) of the line of nodes ψ0. Using the R-band image we did a simple isophote fitting using the STSDAS.ELLIPSE task to obtain the position angle of the major (PA = 120°) and minor (PA = 245°) axes. The inclination of the galaxy with respect to the plane of the sky was computed in ~41°, as cos (i) = b/a, where b and a are the minor and major semi-axes of the galaxy, respectively.
According to Bertola et al. (1991), this assumption results in an observed radial circular velocity v(r,ψ) in the plane of the sky given by (see Eq. (2) in their paper):
![Mathematical equation: \begin{equation} v(r,\psi) = V_{\rm sys} + \left[\frac{V_{0}R\cos(\psi-\psi_{0})\sin(i)\cos(i)}{R^{2}\eta+R^{2}_{\rm c}\cos^{2}(i)}\right] \end{equation}](/articles/aa/full_html/2013/11/aa19721-12/aa19721-12-eq76.png) (1)with
(1)with ![Mathematical equation: \begin{equation} \eta = \left[\sin^{2}(\psi-\psi_{0}) + \cos^{2}(i)\cos^{2}(\psi-\psi_{0})\right], \end{equation}](/articles/aa/full_html/2013/11/aa19721-12/aa19721-12-eq77.png) (2)where Vsys is the systemic velocity, R is the radius in the plane of the galaxy and V0 and Rc are parameters that define the amplitude and shape of the curve. The fit of the rotation curves for each nucleus and position angle are also shown in Fig. 8, and the parameters obtained are listed in Table 7.
(2)where Vsys is the systemic velocity, R is the radius in the plane of the galaxy and V0 and Rc are parameters that define the amplitude and shape of the curve. The fit of the rotation curves for each nucleus and position angle are also shown in Fig. 8, and the parameters obtained are listed in Table 7.
Kinematical parameters for FM 287-14.
 |
Fig. 8 From top to bottom: radial velocity and velocity dipersion as functions of radius along each position angles. The fits of the rotation curves are shown and the parameters obtained are listed in Table 7. No correction for the inclination on the plane of the sky was computed. |
 |
Fig. 9 Optical spectra of the main nucleus with different gratings. The main absorption features on the PA = 113° (B600) (top) and PA = 113° (R400) (bottom) are identified. The [N ii]λ6583 emission line was identified in this last spectrum. |
 |
Fig. 11 Optical spectra of the apparently second nucleus. The main absorption features on the PA = 253° (B600) (top) and PA = 253° (R400) (bottom) are identified. No [N ii]λ6583 emission line is present in the bottom panel. |
 |
Fig. 12 Optical spectra of two H ii regions on the rings. The stellar population synthesis for the central bin along PA = 113° (R400, top), PA = 253° (B600, middle), and PA = 253° (R400, bottom). Spectra have been corrected for reddening (full line) and the synthesized spectra (dashed line, overlaid and shifted by a constant). |
In recent years, a number of similar implementations of the full spectrum fitting method were made by different groups. In this study, to measure the stellar kinematics of the stars and the emission-line fluxes of our spectra, we followed the methods of Cappellari & Emsellem (2004) and Sarzi et al. (2006), respectively4.
We separated the contribution of the stellar continuum and of the ionized-gas emission to the observed galaxy spectrum by fitting simultaneously stellar population templates and Gaussian emission-line templates to the data. We used the Bruzual & Charlot (2003) stellar population models used by Tremonti et al. (2004). The BC03 models incorporate an empirical spectral library (Le Borgne et al. 2003) with a 3200−9300 Å coverage and spectral resolution of ~3 Å. We also account for the impact of diffuse dust in the galaxy of dust in the emission-line regions, which allows a decrement on the strength of the Balmer lines to be obtained that is at least what is expected by recombination theory.
Although the position angles of the long-slit spectroscopic observations do not sample the largest possible number of extranuclear H ii regions, three of them have been encompassed, and Fig. 12 displays their spectra. They resemble those of H ii regions and do not show any contribution of a nuclear central galactic activity (e.g., lines of high excitation, such as Ne vλ3426 or [He ii]λ4686). On the other hand, although the spectra contain significant amounts of nebular emission in the optical wavelength range, the stellar absorption features are still dominant overall, and therefore the measurement of the gas distribution and kinematics requires a careful separation of the line emission from the stellar absorption. Thus, from the fit to the stellar continuum and absorption features, we measured the line-of-sight velocities and velocity dispersions by assuming a Gaussian line-of sight velocity distribution. The associated errors were obtained from the fitting algorithm. From subtraction of the emission-line spectrum from the observed one, we get the clean absorption line spectrum free from emission-line contamination. The method is capable of reproducing the stellar continua of real galaxy spectra very well. We find that a zero-level residual continuum is adequate to fit the emission lines, even the region around Hβ. An inspection of the spectral fits shows that the synthetic spectrum was modeled well and is not overestimated in the continuum around Hβ.
Figure 12 shows the results of the stellar population synthesis along PA = 113° (R400) and 253° (B600, R400) slit positions. We used the IRAF SPLOT routine to fit the lines. The resulting flux errors were estimated from the continuum rms and Poissonian error of the measured line flux.
3.2.2. Standard diagnostic diagrams and empirical boundaries
Emission-line diagnostic diagrams are a powerful way to probe the nature of the dominant ionizing source in galaxies (Baldwin et al. 1981, hereafter BPT). They have shown empirically that several combinations of easily-measured emission lines can be used to separate narrow-emission-line galaxies into one of three categories according to the principal excitation mechanism: nuclear H ii regions or starbursts, Seyfert 2 galaxies and LINERs (Low Ionization Nuclear Emission line Regions). According to the authors, the three categories can be effectively segregated using plots of [N ii]λ6583/Hα versus [O iii] λ5007/Hβ and of [O ii]λ3727/[O iii]λ5007 versus [O iiiλ5007/Hβ, [N iiλ6583/Hα, or [O i] λ6300/Hα.
Afterwards, the BPT scheme was reviewed by Osterbrock & Pogge (1985) and Veilleux & Osterbrock (1987), with a method of classification involving the line ratio log ([O iii]λ5007/Hβ) versus log ([O i]λ6300/Hα), log ([N ii]λ6583/Hα), or log ([S ii] λλ6716, 6731/Hα). These line ratios take full advantage of the physical distinctions between the various types of objects and minimize the effects of reddening correction and calibration errors.
In this work, we use the diagram of the optical line ratio [O iii]λ5007/Hβ versus [N ii]λ6583/Hα (see first panel of Fig. 14, PA = 253°, R400). The result characterizes the spectrum as a H ii galaxy-like. In the diagram, the solid line represents the empirical SF (star-forming) line of Kauffmann et al. (2003, labeled Ka03), while the heavy-dashed line is the theoretical maximum starburst model from Kewley et al. (2001), with the uncertainty of 0.1 dex in both planes. The galaxies in between these two lines are SF−AGN composites or “transition region objects”. Galaxies below the Ka03 line are dominated by SF. The division line between Seyferts and LINERs is shown as the horizontal straight line following Filippenko & Terlevich (1992). Finally, the dot-dashed line indicates the group of “Transition Objects”, noted by Ho et al. (1993).
In addition, we also used the diagnostic diagram [N ii]λ6584/ Hα versus [S ii]λλ6716,6731/Hα proposed by Coziol et al. (1999) to separate the regions where AGNs (Seyfert 2 galaxies and LINERs) dominate as the main source of ionization of the gas, instead of O and B stars. In this case, this diagnostic also confirms the spectra as H ii galaxies-type (see second panel of Fig. 14). This diagnostic diagram does not allow the distinction between the two AGN types, but regions submitted to photoionization by O and B stars are clearly separated from AGN ionizing sources.
4. Discussion and conclusions
In the Catalogue of Southern Peculiar Galaxies and Associations (Arp & Madore 1977, 1986), there are objects that show rings in their morphology (category 6 on the Arp & Madore catalog), and that have been named as peculiar ring galaxies (pRG) after the classification suggested by FAOA. FM 287-14 is a pRG where signatures of tidal perturbations are clearly visible.
FM 287-14 is the central object of the Abell S0959 cluster of galaxies, which has only seven quoted members in Abell’s catalog (Abell et al. 1989). The photometric and spectroscopic observations of FM 287-14 suggest an ongoing merging of the main object, a probable disk galaxy, with a second object that was probably a dwarf elliptical because there are no evidence of structures resembling disk remnants or filaments related to this second object. FM 287-14 is particularly interesting because there is morphological and kinematical suggestion of the existence of two nuclear components (a double nuclei-like object), a feature of probable origin in a past merging with a companion galaxy (see Fig. 2). The merging scenario is reinforced by the presence of the following structures: (1) a very faint N-W filament with a symmetrical extended counterpart, also notorious on the SE; (2) the extended rim-like structure displayed in the top panel of Fig. 1; (3) two visible wave-like ring structures extending to the N direction, where the star formation within an underlying gaseous disk can be seen (the passage of a strong shock wave in this direction throughout the disk), probably triggering the burst of new stars, as a consequence of the collision of the main galaxy with another object; (4) a ring-like structure surrounding the bulge (see bottom panel of Fig. 1) (for samples of recent mergers see Schweizer 1980; Quinn 1984; Schweizer & Seitzer 1992b; see also a review by Barnes 1992). In this context, double-nuclei galaxies are probable evidence of a hierarchical scenario (Toomre & Toomre 1972; Schweizer 1992; and Kormendy 1990), where some galaxies accrete nearby lower mass objects during their lifetime, evolving into a new type of galaxy after the process. A recent review concerning global demographics and properties of spirals, lenticulars, ellipticals, and merger galaxies has been presented by Blanton & Moustakas (2009).
On the study of poor starburst interacting galaxies, Bergvall et al. (2003) report that UBV colors do not show any significant enhancement of starforming activity in the interacting/merging galaxies (and it happens that, like FM 287-14, a few of the sampled objects are double-nucleus galaxies). In this aspect, they conclude interacting and merging galaxies generally do not differ dramatically from normal and isolated galaxies, from the global star formation point of view. To review this statement, we used the BVRJHK photometric data points from NED for the Bergvall’s samples, and we confirm that the different combinations of the BVRJHK color diagrams of interacting/merging galaxies did not show significant scatter as compared to normal ones, and FM 287-14 is well placed in the middle of the diagrams of JHK colors distribution of Bergvall’s sample. There is, nonetheless, a lack of V data in the literature that could be used to compare the FM 287-14 BVR results of the present work with the isolated and interacting/merging galaxies of the Bergvalss sample and with other collisional rings with star-forming knots (e.g., Appleton & Marston 1997; and Bransford et al. 1998). In spite of the lack of BRV magnitudes in the literature, it was possible to draw Fig. 13, which displays: (a) upper panel, the (J − H) versus (J − K) color diagram for a small NED sample of galaxies of 0.02 ≤ z ≤ 0.08; (b) middle panel, the (B − R) versus (J − K) color diagram where FM 287-14 is close to the interacting pair of galaxies ESO 299-IG01 (both elliptical/S0-like with evolving rings); and (c) lower panel, the location of FM 287-14 in the (B − R) versus (B − V) color diagram with some Bergvall objects, the star-forming ring galaxy HRG 2302 (Myrrha et al. 1999) and the isolated ringed Seyfert/LINER galaxy HRG 54103 (Faúndez-Abans et al. 2009), the three observed with the same telescope, instrument setup, and standard group of stars. In spite of the small number of points in the lower panel of Fig. 13, the nuclear contribution of FM 287-14 appears redder than the HRG 54103 object with AGN activity and the bluer distribution of HRG 2302 with H ii behavior. The data on FM 287-14 displayed by Johanson & Bergell (1990) is bluer than ours, and it lies in between HRG 54103 and HRG 2302 data. In the upper panel of Fig. 13, the linear correlation of the Bergvall interacting/merging and normal/isolated galaxies have closer slopes of 0.51 and 0.58, respectively.
The distribution of colors along the main sections of FM 287-14 shows a clear trend (Fig. 7), where the redder and bluer regions are very distinguishable. The SE large filament, the “Jet” in Table 4, shows a mix of colors probably from the mixed population remnant of the interaction of the both objects.
The spectra of both nuclei show early-type characteristics (Figs. 9–11), both with a velocity difference of only ΔV = 34 ± 44 km s-1. The main nucleus displays a weak [N ii]λ6583 line, which, at such a low signal level, is not frequently found in early-type objects (Crawford et al. 1999). The occurrence of [N ii]-only line emission is commonly found in normal elliptical galaxies, and differ from those of non-line-emitting, dominant galaxies (Crawford et al. 1999). There are two possible scenarios for FM 287-14: (a) after partially consuming its gas, the main galaxy (the molecular clouds where stars are formed) went through a quiet evolution where its stellar population got older, but some faint emission lines remained, so that this object could be considered an extreme case of “quiescent” galaxy (Stasińska et al. 2008); (b) [N ii]-only line emission systems are very similar to the low-level LINER activity, a phenomenon commonly found in many normal elliptical galaxies (see Crawford et al. 1999; and Phillips et al. 1986).
 |
Fig. 13 Diagnostic color–color diagrams. The symbols represent (◯) and (+) the Bergvall’s interacting/merging and normal/isolated galaxies, respectively; (▽) LINERS; (△) Ellipticals; (✩) Seyfert 1; (Λ) Seyfert 2, and (•) FM 287-14. In the lower panel ⋆ and (▲) are the galaxies HRG 2302 and HRG 54103, respectively. |
The second nucleus exhibits normal early-type galaxy characteristics with no evidence of any changes with the ongoing interaction. The ring-like structures show clear star formation regions (see Figs. 1 and 12) that must have been triggered by the passage of a density shock wave along the disk of the main galaxy during the impact. There was enough gas and dust in the disk of the main object to trigger this burst of stars, and there may have been some contribution by tidal waves from the second disrupted object. To characterize the most prominent emission lines of the ring, we adopted the empirical method of the diagnostic diagram log [O iii]λ5007/Hβ versus log [N ii]λ6583/Hα and log [S ii]/Hα versus log [N ii]/Hα. The locus of the emission-line ratios in Fig. 14 shows that the emission comes from pure star-forming regions with normal level of excitation (Coziol et al. 1999; see also the diagnostic diagrams by Torres-Papaqui et al. 2012). The result confirms that these regions were formed by the passage of a density shock wave along the disk. Finally, the spectra of the H ii regions (Fig. 12 upper and lower panels) show a bluer continuum, in agreement with those of starburst galaxies, (see Kinney et al. 1996, for galaxy templates), and resemble the contribution of young bursts of luminous WR galaxies (Fernandes et al. 2004).
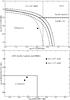 |
Fig. 14 Diagnostic diagrams. Top panel: log [O iii]/Hβ versus log [N ii]/Hα. Bottom panel: log [S ii]λλ6716,6730/Hβ versus log [N ii]λ6583/Hα. The full lines separate the different types of galaxies. |
Criteria for spectral classification have been used to classify the extranuclear H ii regions as starburst. The (B − R) versus (B − V) color diagram shows a clear red bulge and nuclei, redder than those of galaxies HRG 54103 and HRG 2302, which are objects with nuclear AGN and H ii activity, respectively. The colors of the H ii regions are compatible with the H ii regions of HRG 2302. Finally, we propose that the structures displayed by FM 287-14 are associated with a recent ongoing interaction/merge with a disrupted companion.
IRAF: Image Reduction and Analysis Facility is distributed by the National Optical Astronomy Observatory, which is operated by the Association of Universities for Research in Astronomy, Inc., under cooperative agreement with the National Science Foundation.
References and description of the spectroscopic standards at http://www.gemini.edu/sciops/instruments/gmos/calibration
We made use of the corresponding PPXF and GANDALF IDL (Interactive Data Language) codes. Both softwares can be retrieved at http://www.strw.leidenuniv.nl/sauron/
Acknowledgments
This work was partially supported by the Brazilian Ministério da Ciência, Tecnologia e Inovaćão (MCTI), Laboratório Nacional de Astrofísica (MCTI/LNA), by the CNPq 473465/2004-3 grant, by VITAE B-13402/1, and UEFS/DFIS/OAA. Based on observations obtained at (a) Observatório do Pico dos Dias (OPD), which is operated by the LNA/MCTI, Brazil; (b) the Gemini Observatory, which is operated by the Association of Universities for Research in Astronomy, Inc., under a cooperative agreement with the NSF on behalf of the Gemini partnership: the National Science Foundation (United States), the Science and Technology Facilities Council (United Kingdom), the National Research Council (Canada), CONICYT (Chile), the Australian Research Council (Australia), Ministério da Ciência, Tecnologia e Inovaćão (Brazil) and Ministerio de Ciencia, Tecnología e Innovación Productiva (Argentina). The observations were performed under identification number GS-2006A-DD-11. This publication makes use of data products from the Two Micron All Sky Survey, which is a joint project of the University of Massachusetts and the Infrared Processing and Analysis Center/California Institute of Technology, funded by the National Aeronautics and Space Administration and the National Science Foundation. The NASA Extragalactic Database – NED – is operated under the management of the CalTech Jet Propulsion Laboratory, in accordance with a contract from NASA.This research has made use of the NASA/IPAC Infrared Science Archive, which is operated by the Jet Propulsion Laboratory, California Institute of Technology, under contract with the National Aeronautics and Space Administration. The authors are very grateful to the staff of Observatório do Pico dos Dias (LNA/MCTI-Brazil) for their assistance during the observations, and would like to thank Dr. Michael West, Gemini’s Head of Science Operations when the observations were done, for his support and for allocating telescope time as DD-time for this project.
References
- Abell, G. O., Corwin-Jr, H. G., & Olowin, R. P. 1989, ApJS, 70,1 [NASA ADS] [CrossRef] [EDP Sciences] [Google Scholar]
- Alonso, M. S., Lambas, D. G., Tissera, P., & Coldwell, G. 2007. MNRAS, 375, 1017 [Google Scholar]
- Appleton, P. N., & Marston, A. P. 1997, AJ, 113, 201 [NASA ADS] [CrossRef] [Google Scholar]
- Arp, H. C., & Madore, B. F. 1977, QJRAS, 18, 234 [Google Scholar]
- Arp, H. C., & Madore, B. F. 1986, Catalogue of Southern Peculiar Galaxies and Associations, I, Positions and Descriptions, Clarke-Irwin, Toronto [Google Scholar]
- Baldwin, J. A., & Stone, R. P. S. 1984, MNRAS, 206, 241 [NASA ADS] [Google Scholar]
- Baldwin, J. A., Phillips, M. M., & Terlevich, R. 1981, PASP, 93, 5 [NASA ADS] [CrossRef] [EDP Sciences] [Google Scholar]
- Barnes, J. E. 1992, ARA&A, 30, 705 [NASA ADS] [CrossRef] [Google Scholar]
- Barnes, J. E., & Hernquist, L. 1992, ARA&A, 30, 705 [NASA ADS] [CrossRef] [Google Scholar]
- Barnes, J. E., & Hernquist, L. 1996, ApJ, 471, 115 [NASA ADS] [CrossRef] [Google Scholar]
- Barton, E. J., Geller, M. J., & Kenyon, S. J. 2000, ApJ, 530, 660 [NASA ADS] [CrossRef] [Google Scholar]
- Barton, E. J., Arnold, J. A., Zentner, A. R., Bullock, J. S., & Wechsler, R. H. 2007, ApJ, 671, 1538 [NASA ADS] [CrossRef] [Google Scholar]
- Begelman, M. C., Blandford, R. D., & Rees, M. J. 1980, Nature, 287, 307 [NASA ADS] [CrossRef] [Google Scholar]
- Bender, R., Döbereiner, S., & Möllenhoff, C. 1988, A&AS, 74, 385 [NASA ADS] [Google Scholar]
- Bertola, F., Bettoni, D., Danziger, J., et al. 1991, ApJ, 373, 369 [NASA ADS] [CrossRef] [Google Scholar]
- Bergvall, N., Laurikainen, E., & Aalto, S. 2003, A&A, 405, 31 [NASA ADS] [CrossRef] [EDP Sciences] [Google Scholar]
- Bessel, M. 1990, PASP, 102, 1181 [NASA ADS] [CrossRef] [Google Scholar]
- Blanton, M. R., & Moustakas, J. 2009, ARA&A, 47, 159 [NASA ADS] [CrossRef] [Google Scholar]
- Bournaud, F., Duc, P.-A., Amram, P., et al. 2004, A&A, 425, 813 [NASA ADS] [CrossRef] [EDP Sciences] [Google Scholar]
- Bransford, M. A., Appleton, P. N., Marston, A. P., & Charmandaris, V. 1998, AJ, 116, 2757 [NASA ADS] [CrossRef] [Google Scholar]
- Bruzual, G., & Charlot, S. 2003, MNRAS, 344, 1000 [NASA ADS] [CrossRef] [Google Scholar]
- Busko, I. C., 1996, in ASP Conf. Ser. 101, Astronomical Data Analysis Software and Systems V, eds. G. H. Jacoby, & J. Barnes, 139 [Google Scholar]
- Calzetti, D., Armus, L., Bohlin, R. C., et al. 2000, ApJ, 533, 682 [NASA ADS] [CrossRef] [Google Scholar]
- Cappellari, M., & Emsellem, E., 2004, PASP, 116, 138 [NASA ADS] [CrossRef] [Google Scholar]
- Cardelli, J. A., Clayton, G. C., & Mathis, J. S. 1989, ApJ, 345, 245 [NASA ADS] [CrossRef] [Google Scholar]
- Coziol, R., Reyes, R. E. C., Considère, S., et al. 1999, A&A, 345, 733 [NASA ADS] [Google Scholar]
- Crawford, C. S., Allen, S. W. H., Ebeling, H., Edge, A. C., & Fabian, A. C. 1999, MNRAS, 306, 857 [NASA ADS] [CrossRef] [Google Scholar]
- di Matteo, P., Combes, F., Melchior, A.-L., & Semelin, B. 2007, A&A, 468, 61 [NASA ADS] [CrossRef] [EDP Sciences] [Google Scholar]
- di Matteo, P., Bournaud, F., Martig, M., et al. 2008, A&A, 492, 31 [NASA ADS] [CrossRef] [EDP Sciences] [Google Scholar]
- Ellison, S. L., Patton, D. R., Simard, L., & McConnachie, A. W. 2008, AJ, 135, 1877 [NASA ADS] [CrossRef] [Google Scholar]
- Faúndez-Abans, M., & de Oliveira-Abans, M. 1998a, A&AS, 129, 357 (FAOA) [NASA ADS] [CrossRef] [EDP Sciences] [Google Scholar]
- Faúndez-Abans, M., & de Oliveira-Abans, M. 1998b, A&AS, 128, 289 [NASA ADS] [CrossRef] [EDP Sciences] [Google Scholar]
- Faúndez-Abans, M., Fernandes, I. F., de Oliveira-Abans, M., Poppe, P. C. R., & Martin, V. A. F. 2009, A&A, 507, 1303 [NASA ADS] [CrossRef] [EDP Sciences] [Google Scholar]
- Fernandes, I. F., de Carvalho, R., Contini, T., & Gal, R. R. 2004, MNRAS, 355, 728 [NASA ADS] [CrossRef] [Google Scholar]
- Filippenko, A. V., & Terlevich, R. 1992, ApJ, 397, L79 [NASA ADS] [CrossRef] [Google Scholar]
- Freedman, W. L., Madore, B. F., Gibson, B. K., et al. 2001, ApJ, 553, 47 [NASA ADS] [CrossRef] [Google Scholar]
- Hamuy, M., Walker, A. R., Suntzeff, N. B., et al. 1992, PASP 104, 533 [Google Scholar]
- Hamuy, M., Suntzeff, N. B., Heathcote, S. R., et al. 1994, PASP 106, 566 [Google Scholar]
- Ho, L. C., Shields, J. C., & Filippenko, A. V. 1993, ApJ, 410, 567 [NASA ADS] [CrossRef] [Google Scholar]
- Hook, I. M., Jorgensen, I., Allington-Smith, J. R., et al. 2004, PASP, 166, 425 [NASA ADS] [CrossRef] [Google Scholar]
- Hughes, D. H., Serjeant, S., Dunlop, J., et al. 1998, Nature, 394, 241 [NASA ADS] [CrossRef] [Google Scholar]
- Jedrzejewski, R. I. 1987, MNRAS, 226, 747 [Google Scholar]
- Johansson, L., & Bergvall, N. 1990, A&AS, 86, 167 [NASA ADS] [Google Scholar]
- Kauffmann, G., Heckman, T. M., Tremonti, C., et al. 2003, MNRAS, 346, 1055 [Google Scholar]
- Kewley, L. J., Dopita, M. A., Sutherlend, R. S., et al. 2001, ApJ, 556, 121 [Google Scholar]
- Kinney, A. L., Calzetti, D., Bohlin, R. C., et al. 1996, ApJ, 467, 38 [NASA ADS] [CrossRef] [Google Scholar]
- Kormendy, J. 1990, in Dynamics and Interactions of Galaxies, ed. R. Wielen (Berlin, Heidelberg: Springer), 499 [Google Scholar]
- Kuo, C.-Yu., Lim, J., Tang, Ya-Wen., & Ho, P. T. P. 2008, ApJ, 679, 1047 [NASA ADS] [CrossRef] [Google Scholar]
- Kurtz, M. J., & Mink, D. J. 1998, PASP, 110, 934 [NASA ADS] [CrossRef] [Google Scholar]
- Lambas, D. G., Tissera, P. B., Alonso, M. S., et al. 2003, MNRAS, 346, 1189 [NASA ADS] [CrossRef] [Google Scholar]
- Landolt, A. U. 1992, AJ, 104, 340 [NASA ADS] [CrossRef] [Google Scholar]
- Larson, R. B., & Tinsley, B. M. 1978, ApJ, 219, 46 [NASA ADS] [CrossRef] [Google Scholar]
- Le Borgne, J.-F., Bruzual, G., Pelló, R., et al. 2003, A&A, 402, 433 [NASA ADS] [CrossRef] [EDP Sciences] [Google Scholar]
- Li, C., Kauffmann, G., Heckman, T. M., Jing, Y. P., & White, S. D. M. 2008a, MNRAS, 385, 1903 [NASA ADS] [CrossRef] [Google Scholar]
- Li, C., Kauffmann, G., Heckman, T. M., White, S. D. M., & Jing, Y. P. 2008b, MNRAS, 385, 1915 [NASA ADS] [CrossRef] [Google Scholar]
- Madejsky, R. 1991, A&A, 247, 348 [NASA ADS] [Google Scholar]
- Martinet, L. 1995, Fund. Cosm. Phys., 15, 341 [Google Scholar]
- Mihos, J. C., & Hernquist, L. 1996, ApJ, 464, 641 [NASA ADS] [CrossRef] [Google Scholar]
- Myrrha, M. L. M., Vaz, L. P. R., Faúndez-Abans, M., de Oliveira-Abans, M., & Soares, D. S. L. 1999, A&A, 351, 860 [NASA ADS] [Google Scholar]
- Osterbrock, D. E., & Pogge, R. W. 1985, ApJ, 297, 166 [NASA ADS] [CrossRef] [Google Scholar]
- Panter, B., Jimenez, R., Heavens, A. F., & Charlot, S. 2007, MNRAS, 378, 1550 [NASA ADS] [CrossRef] [Google Scholar]
- Phillips, M. M., Jenkins, C. R., Dopita, M. A., Sadler, E. M., & Binette, L. 1986, AJ, 91, 1062 [NASA ADS] [CrossRef] [Google Scholar]
- Quinn, P. J. 1984, ApJ, 279, 596 [NASA ADS] [CrossRef] [Google Scholar]
- Reshetnikov, V. P., Hegen-Thorn, V. A., & Yakovleva, V. A. 1994, A&A, 290, 693 [NASA ADS] [Google Scholar]
- Rich, R. M., Collins, M. L. M., Black, C. M., et al. 2012, Nature, 482, 192 [NASA ADS] [CrossRef] [Google Scholar]
- Sánchez, S. F., Becker, T., Garcia-Lorenzo, B., et al. 2005, A&A, 429, L21 [NASA ADS] [CrossRef] [EDP Sciences] [Google Scholar]
- Sarzi, M., Falcón-Barroso, J., Davies, R. L., et al. 2006, MNRAS, 366, 1151 [NASA ADS] [CrossRef] [Google Scholar]
- Schlegel, D. J., Finkbeiner, D. P., & Davis, M. 1998, ApJ, 500, 525 [NASA ADS] [CrossRef] [Google Scholar]
- Schweizer, F. 1980, ApJ, 237, 303 [NASA ADS] [CrossRef] [Google Scholar]
- Schweizer, F. 1992, in Physics of Nearby Galaxies: Nature or Nurture?, eds. T. X. Thuan, C. Balkowaki, & J. Trân Thanh Vân (Éditions Frontières, Gif-sur-Yvette) [Google Scholar]
- Schweizer, F., & Seitzer, P. 1992a, AJ, 92, 104 [CrossRef] [Google Scholar]
- Schweizer, F., & Seitzer, P. 1992b, AJ, 104, 1039 [NASA ADS] [CrossRef] [Google Scholar]
- Shlosman, I., Begelman, M. C., & Frank, J. 1990, Nature, 345, 679 [NASA ADS] [CrossRef] [Google Scholar]
- Simkin, S. M., Su, H. J., & Schwartz, M. P. 1980, ApJ, 237, 404 [NASA ADS] [CrossRef] [Google Scholar]
- Somerviile, R. S., & Primack, J. R. 1999, MNRAS, 310, 1087 [CrossRef] [Google Scholar]
- Somerville, R. S., Lemson, G., Kolatt, T. S., & Dekel, A. 2000, MNRAS, 316, 479 [NASA ADS] [CrossRef] [Google Scholar]
- Smirnova, A. A., Moiseev, A. V., & Afanasiev, V. L. 2006, Astron. Lett., 32, 520 [NASA ADS] [CrossRef] [Google Scholar]
- Stasinska, G., Asari, N. V., Cid Fernandes, R., et al. 2008, MNRAS, 391, L29 [NASA ADS] [Google Scholar]
- Tang, Ya-Wen., Kuo, C.-Yu., Lim, J., & Ho, P. T. P. 2008, ApJ, 679, 1094 [NASA ADS] [CrossRef] [Google Scholar]
- Torres-Papaqui, J. P., Coziol, R., Ortega-Manikata, R. A., & Nari-Larios, D. M. 2012, ApJ, 754, 144 [NASA ADS] [CrossRef] [Google Scholar]
- Toomre, A. 1978, in The large scale structure of the universe, Proc. of the Symp., Tallin, Estonian SSR (Dordrecht: Reidel Publishing), 109 [Google Scholar]
- Toomre, A., & Toomre, J. 1972, ApJ, 178, 623 [NASA ADS] [CrossRef] [Google Scholar]
- Tremonti, C. A., Heckman, T. M., Kauffmann, G., et al. 2004, ApJ, 613, 898 [NASA ADS] [CrossRef] [Google Scholar]
- Veilleux, S., & Osterbrock, D. E. 1987, ApJS, 63, 295 [NASA ADS] [CrossRef] [Google Scholar]
- Wenderoth, E., Faúndez-Abans, M., Krabbe, A. C., de Oliveira-Abans, M., & Cuevas, H. 2011, A&A, 529, A157 [NASA ADS] [CrossRef] [EDP Sciences] [Google Scholar]
- Zou, Z. L., Xia, X. Y., Deng, Z. G., & Wu, H. 1995, A&A, 304, 369 [NASA ADS] [Google Scholar]
All Tables
All Figures
|
Fig. 1 2.′2 × 1.′8 V-band image of FM 287-14. Top: the huge visible halo. shells and a tidal filament, enhanced by a 500-pixel2 median kernel filtering of the original image. Bottom: the same image in a different contrast: (1) the bulge and the central region; (2) a ring-like structure surrounding the bulge; and (3) a partial outer ring spreading to the N direction, which may be the locus of intense star formation within an underlying gaseous disk. See Table 5 for photometric measurements of the numbered regions. |
| In the text | |
|
Fig. 2 R-band image, where the double nuclei can be seen. Both panels show both nuclei with different contrasts to highlight their main morphological features. The PA slit positions are displayed in the first panel. The dashed circles show the position of the two H ii regions encompassed by both slits reported in this work. |
| In the text | |
|
Fig. 3 Upper panel: r-band luminosity profile for FM 287-14. The bulge-fitting function is represented by a continuous line and the disk by the dashed one. Lower panel: ellipticity variation from the center in arcsec. |
| In the text | |
|
Fig. 4 Upper panel: average radial variation in the B4 coefficient. Lower panel: sequencial locations of the model isophotes’ center coordinates as they are fitted outwards. |
| In the text | |
|
Fig. 5 R-band Fourier hologram enhancing the faint signals around the bulge. |
| In the text | |
|
Fig. 6 Brightness profiles extracted from a 0.28′′-aperture width: PA = 253° (SW-NE, full line) and PA = 113° (SE-NW, dashed line). The arrow indicates presence of the second nucleus. |
| In the text | |
|
Fig. 7 H ii regions of the external and internal ring. Both nuclei are redder, indicating the presence of an old star population. |
| In the text | |
|
Fig. 8 From top to bottom: radial velocity and velocity dipersion as functions of radius along each position angles. The fits of the rotation curves are shown and the parameters obtained are listed in Table 7. No correction for the inclination on the plane of the sky was computed. |
| In the text | |
|
Fig. 9 Optical spectra of the main nucleus with different gratings. The main absorption features on the PA = 113° (B600) (top) and PA = 113° (R400) (bottom) are identified. The [N ii]λ6583 emission line was identified in this last spectrum. |
| In the text | |
 |
Fig. 10 Same as Fig. 9, for PA = 253°. |
| In the text | |
|
Fig. 11 Optical spectra of the apparently second nucleus. The main absorption features on the PA = 253° (B600) (top) and PA = 253° (R400) (bottom) are identified. No [N ii]λ6583 emission line is present in the bottom panel. |
| In the text | |
|
Fig. 12 Optical spectra of two H ii regions on the rings. The stellar population synthesis for the central bin along PA = 113° (R400, top), PA = 253° (B600, middle), and PA = 253° (R400, bottom). Spectra have been corrected for reddening (full line) and the synthesized spectra (dashed line, overlaid and shifted by a constant). |
| In the text | |
|
Fig. 13 Diagnostic color–color diagrams. The symbols represent (◯) and (+) the Bergvall’s interacting/merging and normal/isolated galaxies, respectively; (▽) LINERS; (△) Ellipticals; (✩) Seyfert 1; (Λ) Seyfert 2, and (•) FM 287-14. In the lower panel ⋆ and (▲) are the galaxies HRG 2302 and HRG 54103, respectively. |
| In the text | |
|
Fig. 14 Diagnostic diagrams. Top panel: log [O iii]/Hβ versus log [N ii]/Hα. Bottom panel: log [S ii]λλ6716,6730/Hβ versus log [N ii]λ6583/Hα. The full lines separate the different types of galaxies. |
| In the text | |
Current usage metrics show cumulative count of Article Views (full-text article views including HTML views, PDF and ePub downloads, according to the available data) and Abstracts Views on Vision4Press platform.
Data correspond to usage on the plateform after 2015. The current usage metrics is available 48-96 hours after online publication and is updated daily on week days.
Initial download of the metrics may take a while.