Fig. 8
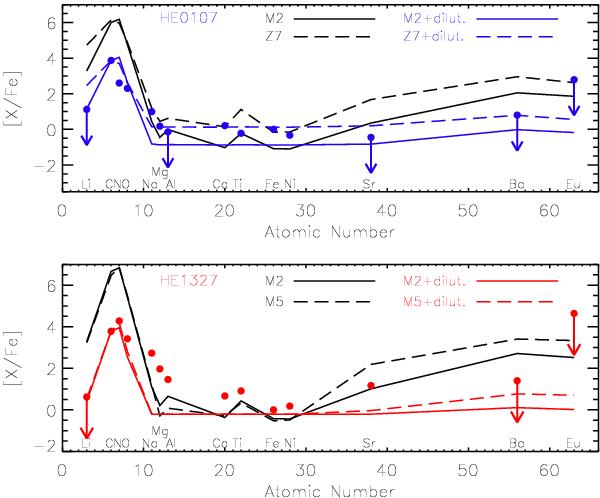
Top panel: abundance pattern of HE0107-5240 (blue filled circles, from Christlieb et al. 2004; and Bessell et al. 2004). Black solid and dashed lines represent the surface abundance of models M2 and Z7 (see Sect. 6 for more details on this model) respectively. Blue lines show the abundance patterns after dilution by factors of fD = 7.4 × 10⁻³ and 5.4 × 10⁻³ (models M2 and Z7 respectively), which are derived by matching the observed carbon abundance. Arrows indicate upper limits. Li abundance is given as log ϵ(Li) = log (NLi/NH) + 12. The zero point on the y-axis corresponds to [Fe/H] = − 5.3. Bottom panel: same as above but for HE-1327-2326 (red filled circles, data from Frebel et al. 2008). For this star, the models shown are M2 and M5. Abundance patterns after dilution (fD = 1.3 × 10⁻³ and 2.1 × 10⁻³ for M2 and M5 respectively) are shown in red solid and dashed lines, as indicated in the plot. The zero point of the y-axis corresponds to [Fe/H] = − 5.96.
Current usage metrics show cumulative count of Article Views (full-text article views including HTML views, PDF and ePub downloads, according to the available data) and Abstracts Views on Vision4Press platform.
Data correspond to usage on the plateform after 2015. The current usage metrics is available 48-96 hours after online publication and is updated daily on week days.
Initial download of the metrics may take a while.