Free Access
Fig. 8
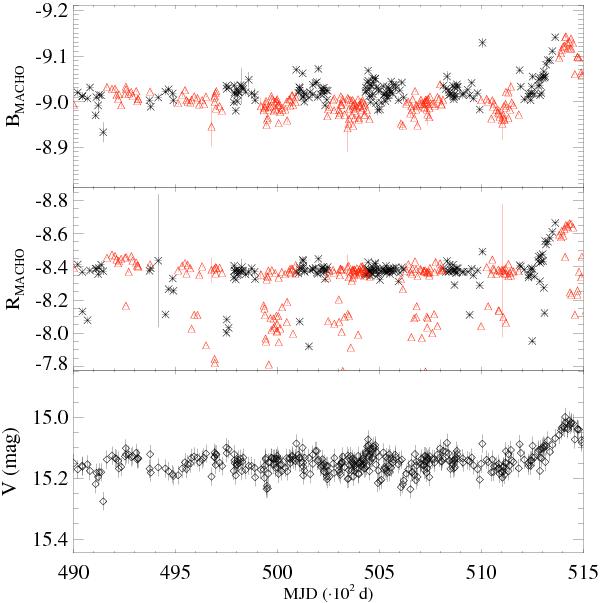
MACHO light curves for a time period of 2541 days: the “blue” BMACHO light curve is plotted on the top panel, the “red” RMACHO in the middle. In both of them red triangles and black stars indicate instrumental magnitudes taken on different pier setup. The corrected Johnson V magnitude is plotted on the bottom panel.
Current usage metrics show cumulative count of Article Views (full-text article views including HTML views, PDF and ePub downloads, according to the available data) and Abstracts Views on Vision4Press platform.
Data correspond to usage on the plateform after 2015. The current usage metrics is available 48-96 hours after online publication and is updated daily on week days.
Initial download of the metrics may take a while.