Free Access
Fig. 3
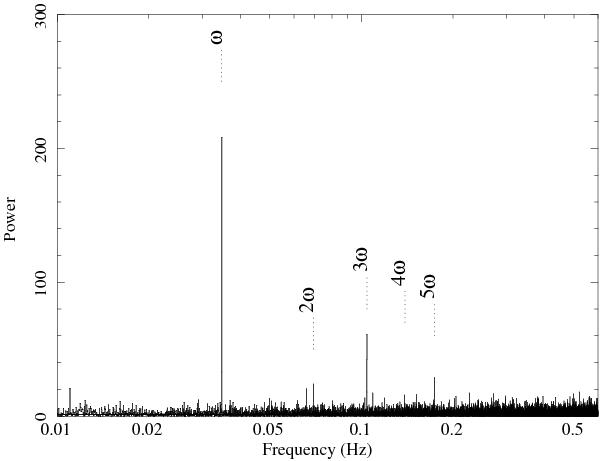
Power density spectrum created from the merged EPIC-pn and EPIC-MOS data in the (0.2−10.0) keV energy band. The time binning of the input light curve is 0.8156671 s. On the plot we can see the best-fit frequency of ω = 0.034752 Hz and its first, second and fourth harmonics.
Current usage metrics show cumulative count of Article Views (full-text article views including HTML views, PDF and ePub downloads, according to the available data) and Abstracts Views on Vision4Press platform.
Data correspond to usage on the plateform after 2015. The current usage metrics is available 48-96 hours after online publication and is updated daily on week days.
Initial download of the metrics may take a while.