Fig. 1
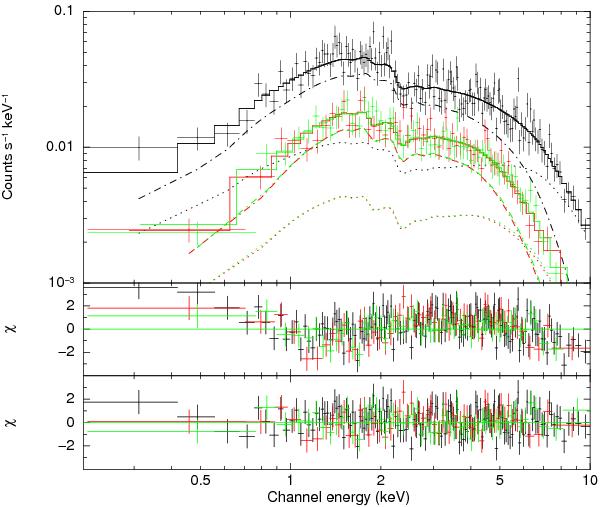
EPIC spectra of Swift J053041.9-665426. The top panel shows the EPIC-pn (black), EPIC-MOS1 (red) and EPIC-MOS2 (green) spectra, together with the best-fit model (solid line) of an absorbed power-law (dotted line) plus a black-body (dash-dotted line). The residuals for this model are plotted below (bottom panel), while for comparison the best-fit single power-law model residuals are also plotted (middle panel).
Current usage metrics show cumulative count of Article Views (full-text article views including HTML views, PDF and ePub downloads, according to the available data) and Abstracts Views on Vision4Press platform.
Data correspond to usage on the plateform after 2015. The current usage metrics is available 48-96 hours after online publication and is updated daily on week days.
Initial download of the metrics may take a while.