Fig. 9
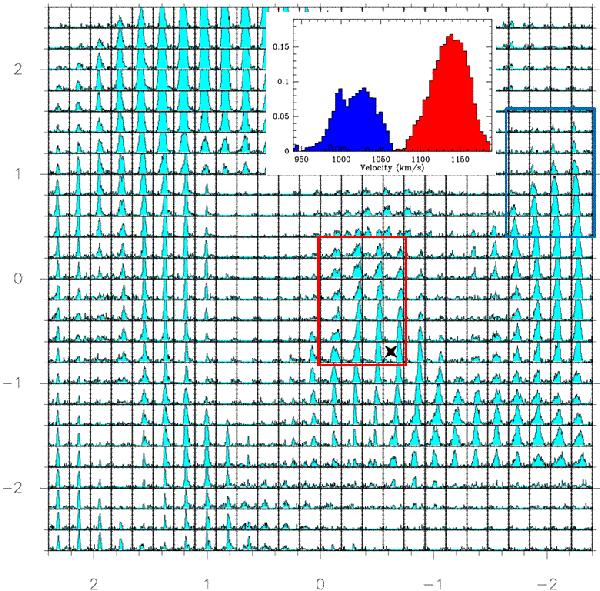
CO(3–2) spectra within 2 5 of the centre. The velocity scale is from 960 to 1190 km s-1 (corresponding to a range from − 115 to 115 km s-1 with respect to the systemic velocity). The vertical scale is from 1 to 40 mJy. The new adopted centre is marked with a black star (the map coordinates are with respect to the phase centre). The red velocity component can be seen at the new centre and just above, and the blue velocity component is centred at (− 2, 0.5). The two regions of 07 × 12 each, selected to integrate the outflow mass in Table 3, are indicated by red and blue rectangles, respectively. The corresponding integrated spectra are plotted in the insert (scale in Jy).
Current usage metrics show cumulative count of Article Views (full-text article views including HTML views, PDF and ePub downloads, according to the available data) and Abstracts Views on Vision4Press platform.
Data correspond to usage on the plateform after 2015. The current usage metrics is available 48-96 hours after online publication and is updated daily on week days.
Initial download of the metrics may take a while.