| Issue |
A&A
Volume 558, October 2013
|
|
|---|---|---|
| Article Number | A96 | |
| Number of page(s) | 6 | |
| Section | Stellar structure and evolution | |
| DOI | https://doi.org/10.1051/0004-6361/201322241 | |
| Published online | 11 October 2013 | |
The eclipsing post-common envelope binary CSS21055: a white dwarf with a probable brown-dwarf companion⋆
1 Institut für Astrophysik, Georg-August-Universität, Friedrich-Hund-Platz 1, 37077 Göttingen, Germany
e-mail: k.beuermann@t-online.de
2 Didaktik der Physik, Universität Duisburg-Essen, Universitätsstr. 2, 45117 Essen, Germany
Received: 9 July 2013
Accepted: 19 September 2013
We report photometric observations of the eclipsing close binary CSS21055 (SDSS J141126+200911) that strongly suggest that the companion to the carbon-oxygen white dwarf is a brown dwarf with a mass between 0.030 and 0.074 M⊙. The measured orbital period is 121.73 min and the totality of the eclipse lasts 125 s. If confirmed, CSS21055 would be the first detached eclipsing WD+BD binary. Spectroscopy in the eclipse could provide information about the companion’s evolutionary state and atmospheric structure.
Key words: binaries: close / binaries: eclipsing / white dwarfs / brown dwarfs / stars: individual: CSS21055 / stars: individual: SDSS J141126+200911
Light curves are only available at the CDS via anonymous ftp to cdsarc.u-strasbg.fr (130.79.128.5) or via http://cdsarc.u-strasbg.fr/viz-bin/qcat?J/A+A/558/A96
© ESO, 2013
1. Introduction
In their list of eclipsing white-dwarf main-sequence binaries drawn from the Catalina Sky Survey (CSS), Drake et al. (2010) included the Sloan Digital Sky Survey (SDSS) source CSS 21055 (SDSS J141126+200911) as a possible eclipsing close binary, without providing further information, however. A single SDSS spectrum of the g = 17.80 source is available (plate number 2771, fiber 0024, MJD 54527)1, which shows a white dwarf (WD) with a hydrogen spectrum of spectral type DA. No signature of a late-type companion is seen. The observed SDSS photometric AB magnitudes (u = 18.240(15), g = 17.800(6), r = 17.981(7), i = 18.190(8), and z = 18.428(27); Adelman et al. 2012) are consistent with the spectral energy distribution of the WD and provide no evidence of an infrared flux excess. Kleinman et al. (2013) derived an effective temperature T1 = 13 074 K, gravity log g = 7.89, and mass M1 = 0.551 M⊙, suggesting that it is a carbon-oxygen WD.
The binary nature was re-discovered by one of us (UB) using the MONET/North telescope within the PlanetFinders project conducted by high-school teachers and their students in collaboration with professional astronomers. The light curves show narrow eclipses suggestive of a brown dwarf (BD) companion. If confirmed, this would make CSS21055 one of the few post-common envelope binaries (PCEB), in which a companion near or below the limit of stable hydrogen burning has survived the common-envelope (CE) event that led to the birth of the WD. The frequency of detached PCEB with WD and BD components is small (Steele et al. 2011) and only very few are known so far. Of these, only two have short orbital periods comparable with CSS 21055. These are NLTT5306 (Steele et al. 2013) and WD0137-349 (Maxted et al. 2006; Burleigh et al. 2006), which are not eclipsing.
In this paper, we present time-resolved photometry of CSS 21055 acquired in 2012 and 2013 that allowed us to obtain an accurate ephemeris and to derive the system parameters from a light-curve analysis.
2. Observations and analysis
2.1. Observations
The binary CSS 21055 was observed with the 1.2-m MONET/North telescope at the University of Texas McDonald Observatory via the MONET browser-based remote-observing interface on 24 nights between March 2012 and March 2013, using an Apogee ALTA E47+ 1k × 1k CCD camera. In June 2013, it was observed with the 1.9-m telescope of the South African Astronomical Observatory (SAAO). The source is located at RA(2000) = 14 11 26.2, Dec(2000) = + 20 09 11.1, only from Arcturus. Photometry was performed relative to two 14-mag comparison stars C1 and C2 (SDSS J141125+201013 and SDSS J141123.90+200813.2), located at 62′′ N, 8′′ W and 58′′ S, 42′′ W of CSS21055, respectively. We obtained 6.0 h of data in white light (WL) with exposure times of 10 s or 20 s and 13.8 h in the Bessell I-band (central wavelength 8000 Å) with exposure times between 30 s and 180 s, all separated by 3 s readout. Our extensive observations provided full orbital coverage in the I-band and about 50% coverage in WL. Table 1 provides information on those runs that cover the narrow eclipses, with the last column indicating the telescope used. All additional observations that contribute to the light curves outside the narrow eclipse were performed with MONET/N.
2.2. Ephemeris
The mid-eclipse times were determined from the individual light curves using a uniform-disk model for the white dwarf and the secondary star (see Backhaus et al. 2012; Beuermann et al. 2013). The formal 1-σ errors of the mid-eclipse times were calculated from the measurement errors of the relative fluxes in the individual CCD images, employing standard error propagation. We measured the mid-eclipse times tecl using a fixed inclination of 85° (see below). Table 1 lists the cycle numbers, the mid-eclipse times, and their 1-σ errors. The errors of Tecl in WL vary between 0.3 and 1.6 s, depending on the quality of the individual light curves. The mean timing error is 0.70 s. All mid-eclipse times were converted from UTC to barycentric dynamical time (TDB) and corrected for the light travel time to the solar system barycenter, using the tool provided by Eastman et al. (2010)2. The corrected times are quoted as barycentric Julian days in TDB in Col. 4 of Table 1. The linear ephemeris obtained from the 21 WL mid-eclipse times is  (1)With χ2 = 17.51 for 19 degrees of freedom, there is no evidence for a period change. The O–C values of the mid-eclipse times relative to this ephemeris are quoted in Col. 5 of Table 1.
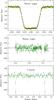 |
Fig. 1 MONET/N white-light and I-band light curves of CSS21055 as a function of orbital phase. Top: eclipse light curve composed of 10 s (yellow) and 20 s (green) exposures. The solid line represents the best-fit model light curve for the model described in Sect. 3.2. Center: unbinned orbital light curve in WL with 20 s exposure times. Bottom: binned light curve in the Bessell I-band. The folded data are displayed for 1.6 orbital periods. |
2.3. Folded light curves
We folded the white-light and the I-band light curves over the orbital period of Eq. (1), obtaining phase-resolved light curves. In previous analyses (e.g., Beuermann et al. 2013), our model fit allowed for a variation of the flux outside eclipse. In the present case, no such allowance was made and we relied on the relative photometry, with the aim to measure the relative orbital modulation. Before coadding the light curves, they were normalized to the mean flux in the phase intervals φ = −0.10 to −0.03 and φ = 0.03 to 0.10. Figure 1 (top panel) shows the folded eclipse light curve in WL for the phase interval φ = −0.035 to 0.035, composed of twelve light curves obtained under the most favorable atmospheric conditions. The yellow and green dots represent 10 s and 20 s exposures, respectively. The mean relative flux in the eclipse is − 0.0009 ± 0.0025. The 1-σ error corresponds to a lower limit to the eclipse depth in WL of 6.5 mag. The central panel shows the coadded WL orbital light curve for cycle numbers E = 0 and 1335. These data cover the phase interval from φ = −0.397 to +0.073 with 20 s exposure times and provide the best signal-to-noise ratio (S/N). The bottom panel shows the phase-folded orbital light curve in the I-band, which is composed of 908 individual exposures taken with exposure times between 30 and 180 s and covering all orbital phases. We binned the data in 41 phase intervals outside eclipse and 9 narrower intervals in eclipse. Neither the WL nor the I-band light curve show evidence for an orbital variation outside the eclipse (see Sect. 3.4 for a discussion).
2.4. I-band flux in eclipse
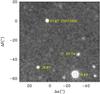 |
Fig. 2 I-band image of the field containing CSS 21055 prior to the total eclipse. The image measures 83″ × 83″, north is up and east is to the left. The integrated exposure time is 1200 s. The quoted I-band magnitudes of stars in the image are converted from the Sloan AB magnitudes. The bright star at the bottom is comparison star C2. |
Instead of averaging the results of the aperture photometry of the individual exposures inside the eclipse, it is more advantageous to measure the flux in a coadded image composed of the images taken in totality. Figures 2 and 3 show the I-band images accumulated over 1200 s outside eclipse and 600 s in the total eclipse. The eclipse image is composed of sixteen 30 s exposures in dark time and two 60 s exposures taken at full moon, the out-of-eclipse image contains twice the number of exposures, extracted from the same five runs (Table 1). Despite the greater sky brightness, including the longer-exposed moon-time data improves the S/N ratio. The pictures show our 14.4 mag comparison star C2 and two stars fainter than CSS21055. Most of the other sources are faint galaxies. The I-band magnitudes quoted in the images were obtained from the SDSS AB magnitudes r, i, and z, using the transformation equations of Lupton (2005)3. Based on the SDSS magnitudes quoted above, CSS21055 has Bessell I = 17.87 outside eclipse, which calibrates our relative photometry. The point spread function of the coadded images in Figs. 2 and 3 has a FWHM of 2.8 pixels. The faint star below the image center has Sloan r = 21.47, i = 21.19, and z = 21.06, or I = 20.74, and is detected in Fig. 3 with a S/N = 8 for an extraction radius of 2.8 pixel. The flux of CSS21055 in eclipse is zero or minimally negative for extraction radii between 2 and 4 pixels. The sky signal in the eclipse image displays a Gaussian distribution with a standard deviation, which translates to an error between 0.72% and 1.00% of the out-of-eclipse flux of CSS21055 for extraction radii between 2 and 4 pixels. The 1-σ lower limits to the magnitude differences are 5.36 mag and 5.00 mag, respectively, implying I-band eclipse magnitudes of I > 23.23 (2 pixel) and I > 22.87 (4 pixel). Conservatively, we adopt the latter. The 2-σ limit is brighter by 0.75 mag.
3. Results
In this section, we derive the orbital parameters of the binary by fitting a purely geometrical model to the phase-folded mean eclipse light curve in WL and and obtain limits on the mass and the absolute magnitude of the secondary by taking recourse to the WD models of Holberg & Bergeron (2006) and Tremblay et al. (2011)4 and the BD models of Chabrier et al. (2000) and Baraffe et al. (2003)5.
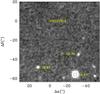 |
Fig. 3 Same as Fig. 2 for an integrated exposure time of 600 s inside the total eclipse. In both pictures, the circles have a radius of one FWHM of the point spread function. |
3.1. The effective temperature of the white dwarf
The parameters of the WD derived by Kleinman et al. (2013) from the SDSS spectrum and photometry are T1 = 13 074 ± 1306 K, log g = 7.89 ± 0.12, and M1 = 0.551 ± 0.058 M⊙. The distance is quoted as 176 pc. Comparison of the WD models with the observed color g − i = −0.39 ± 0.01 translates into a color excess Eg − i between − 0.03 to 0.14 for the full range of the Kleinman et al. parameters. The extinction estimated from the Galactic hydrogen column density NH in the direction of CSS 21055, suggests a narrower range of Eg − i. Using the extinction model of Cardelli et al. (1989) and the calibration between NH in atoms cm-2 and the visual absorption provided by Predehl & Schmitt (1995), we find Eg − i = 0.30 (NH/1021). For the Galactic coordinates of CSS21055, l,b = 16°, + 70°, the NASA HEASARC tool6 yields a total Galactic column density NH,gal = (2.6 ± 0.4) × 1020 atoms cm-2. The actual column density in front of CSS21055 may be substantially smaller, but is unlikely to be zero (see Lallement et al. 2003 for the structure and extent of the local bubble of low-density gas). For CSS 21055 at d ≃ 180 pc, we estimate that Eg − i falls between 0.03 and 0.09, which implies a WD temperature T1 ≃ 13 000 ± 700 K for masses M1 between 0.5 and 0.6 M⊙.
3.2. Geometric-model fit to the mean eclipse light curve
We fit the phase-folded WL eclipse light curve (Fig. 1, top panel) by the geometrical model of a WD eclipsed by the secondary. The free parameters of the fit are the inclination i, the ratio a/R1 of the astrocentric semi-major axis vs. the radius of the primary, the ratio R2/R1 of the radii of secondary and primary, and the surface-brightness ratio S2/S1 of secondary and primary. The model is averaged over the finite exposure times of 10 s or 20 s before calculating χ2 and the fit may include a mixed bag of exposure times. The best-fit model shown in Fig. 1 (top panel) is the one for 10 s exposures. The model curve for 20 s exposures would be slightly more rounded off.
In contrast to Sect. 2.2, we now account for limb darkening of the white dwarf (Gianninas et al. 2013), but keep the assumption of a uniform disk for the companion, which is black for practical purposes. Limb darkening reduces the equivalent uniform-disk diameter of the WD and the fit compensates this by increasing the fitted radius R1, with a corresponding reduction in the implied value of M1 and small changes in all other fit parameters. We adopted a square-root limb-darkening law  , where μ is the cosine of the angle between the emerging ray and the radial direction. The parameters d and f were tabulated by Gianninas et al. (2013) for different photometric bands as functions of Teff and log g of the WD. We also tested a quadratic law, but found no difference in the present fits. As expected, however, with both laws the fit yields a larger R1 and a smaller M1 than for the case of no limb darkening.
Best-fit parameters for CSS21055 with 1-σ correlated errors.
We estimate that the effective central wavelength for our WL data is λc,WL = 6000 ± 200 Å, in the blue half of the Sloan r-band. We performed fits with the coefficients d and f for the Sloan bands g,r, and i, Teff between 12 000 and 14 000 K, and log g = 7.75 and 8.00 and found that the combined systematic error caused by these uncertainties is substantially smaller than the statistical error. In what follows, we use the darkening coefficients for the r-band, Teff = 13 000 K, and log g = 7.75. The fit yields , a/R1 = 47.0 ± 4.4 ± 1.0, and R2/R1 = 5.30 ± 0.94 ± 0.18, where the statistical and the systematic errors are quoted separately. These parameters are listed in part (a) of Table 2 with the two errors added quadratically. The fit has χ2 = 752.9 for 736 degrees of freedom or a reduced  . The best-fit WD mass is 0.52 M⊙ for the adopted limb-darkening law, compared with 0.58 M⊙ for no limb darkening. Low χ2 values are obtained only along a narrow track in the three-dimensional parameter space and all fit parameters are highly correlated. For i as the independent variable, a/R1 and R2/R1 vary as shown by the dashed line in Fig. 4. The area shaded in green shows where
  in the projection of the three-dimensional distribution.
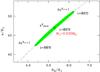 |
Fig. 4 Relation between the best-fit values of a/R1 and R2/R1 for a systematic variation of the inclination i in the light-curve fit (dashed curve). The three crosses (+) indicate the χ2 minimum and the 1-σ error limits. The shaded band represents the region with Δ χ2 < 1. The best-fit WD mass value is noted in red (see text). |
3.3. System parameters of CSS 21055
Combining the light-curve fit and the photometric fit yields a set of internally consistent system parameters. The WD models define R1 as a function of M1 with a minor dependence on T1. Only M1 and R1 enter the geometrical fit explicitely via the parameter a/R1. For simplicity, we assumed that T1 is positively correlated with M1 on the grounds that an increased mass requires a higher temperature to maintain the ionization balance in the line-forming region (see Table 2). The semi-major axis varies as a ∝ (M1 + M2)1/3, which is dominated by the dependence on M1. The combined fit yields the set of parameters a, M1, R1, Eg − i, the g-band extinction Ag, the distance d, and the absolute magnitude Mg of the WD, with errors derived from the uncertainty in a/R1. Sections (b) − (d) of Table 2 list the results for M2 = 0.06 M⊙. As all other parameters, M1 varies systematically with i, assuming values of 0.58 M⊙, 0.52 M⊙, and 0.46 M⊙ for inclinations of , , and , respectively.
The mass of the secondary is a free parameter that is not effectively constrained by the fit, but can be limited by the requirement that it conforms with the (age-dependent) mass-radius relationship R(M) of low-mass objects. The temporal evolution of these objects has been considered by the Lyon group for the two limiting cases of (i) dust included in the radiative transfer equation (DUSTY models, Chabrier et al. 2000); and (ii) dust disregarded in the radiative transfer on the assumption that sedimentation to levels below the photosphere takes place (COND models, Baraffe et al. 2003). DUSTY models may be more appropriate for the secondary in CSS 21055 if its temperature exceeds 1300 K. In Fig. 5, we compare the result of our geometrical model with the R(M) for the DUSTY and COND models. Our solution overlaps with the theoretical radii of both models for ages t > 1 Gyr and M2 between 0.036 and 0.074 M⊙. Our best-fit radius agrees with that of the COND model for 0.06 M⊙ and 10 Gyr, but there is no model corresponding to the lower masses permitted by our fit. If we require overlap with the COND or DUSTY model radii, the permitted WD mass is reduced to 0.52–0.58 M⊙ at the 1-σ level of the geometrical fit, in excellent agreement with the spectroscopic mass of 0.551 ± 0.058 M⊙ (Kleinman et al. 2013). It is noteworthy that the lower age limit set by our fit exceeds the cooling age of the WD, tcool = 0.27 ± 0.09 Gyr for a temperature of 13 000 ± 700 K and a mass between 0.5 and 0.6 M⊙.
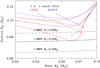 |
Fig. 5 Mass-radius relation of the secondary in CSS 21055 obtained for the best fit (solid line) and the 1-σ limits (dot-dashed lines). Also shown are the mass-radius relations for the DUSTY models of Chabrier et al. (2000, blue curves) and the COND models of Baraffe et al. (2003, red curves) for ages of 0.5, 1, and 10 Gyr (from top). A secondary with an absolute magnitude MI > 16.5 is located below the respectively color-coded dashed lines. |
The non-detection of the secondary in the I-band during the eclipse further restricts M2. The 1-σ limit on the absolute I-band magnitude of the secondary, MI > 16.5, defines an age-dependent maximum mass of the DUSTY or COND models (dashed lines in Fig. 5). For an age of 10 Gyr, the absolute upper mass limits are 0.074 M⊙ and 0.075 M⊙ for the COND and DUSTY models, respectively. For an age t = 1 Gyr, the corresponding limits are reduced to 0.056 M⊙ and 0.068 M⊙. The WL flux in eclipse (Sect. 2.3) corresponds approximately to an absolute R-band magnitude MR ≳ 18.0, which supports the above conclusion, but is less restrictive than the I-band measurement given the steep spectral slope of the COND and DUSTY models. The lower mass limit is between 0.030 and 0.040 M⊙ for the COND models, a range where the DUSTY model may no longer be applicable. Roche lobe overflow is expected only at still lower masses in the planetary regime. Our results define the secondary in CSS21055 fairly reliably as a BD with a radius consistent with the COND or DUSTY models for t > 1 Gyr.
3.4. Irradiation of the secondary
Irradiation of the secondary by the WD is intense in the substellar point and subsides as the nightside is entered. Most of the incident blue and ultraviolet light, however, will be Rayleigh scattered from the atmosphere, while the red and infrared light is mostly absorbed and heats the atmosphere. The details are complex (e.g., Sudarsky et al. 2003). The solid angle subtended by the secondary is Ω = π(R1/a)2 ≃ 0.05 sr (Table 2), and with a wavelength-dependent geometrical albedo Ag ≃ 0.6, 0.3, and <0.05 at 4000 Å, 6500 Å, and 8000 Å (Gelino et al. 1999), we expect a relative orbital modulation of the reflected light fsec,refl(λ)/fwd(λ) = AgΩ/π of 0.9%, 0.4%, and <0.1% in the blue, red, and infrared bands.
Reprocessing of absorbed radiation leads to a position-dependent rise in the effective temperature. A rough estimate is obtained from the average equilibrium temperature T2,eq in the heated hemisphere,  (2)where AB is the Bond albedo and the factor of 1/2 in the bracket accounts for the difference between the cross section and the emitting area of the irradiated hemisphere. For the best-fit parameters in Table 2 and a Bond albedo of 0.5 (Marley et al. 1999), the effective temperature rises moderately from the nightside value T2 ≲ 1800 K for the adopted limit of 1% of the WD flux in the I-band to an average 1925 K in the irradiated hemisphere. From the COND models of Baraffe et al. (2003), we find that the surface brightness in the I-band increases by 1.0 mag for a temperature rise of 250 K, implying a meagre difference between the dark and irradiated hemispheres of only about 0.5 mag and an expected orbital modulation of about 0.55% relative to the I-band flux of the WD. A similar result is obtained for the DUSTY models. Not surprisingly, our observed light curves in WL and in the I-band do not show a measurable enhancement around orbital phase φ = 0.5 due to either effect. We have fitted a light curve calculated with the irradiation model of Beuermann & Reinsch (2008) to the data and obtained an amplitude of 0.26 ± 0.11% for the (unfortunately incomplete) WL light curve and of − 0.25 ± 0.42% for the I-band (solid black curves in Fig. 1, central and bottom panels). Both results are consistent with the BD nature of the secondary as suggested by the non-detection in the I-band eclipse.
4. Discussion
We have found that CSS21055 is a totally eclipsing short-period post-common envelope binary with an orbital period of 121.73 min, containing a WD primary and a probable BD secondary. The likely mass of the companion is between 0.030 and 0.074 M⊙. A planet-sized body is not supported by the fits and would, moreover, overfill its Roche lobe. WD + BD binaries are rare (Steele et al. 2011) and only two such systems with comparable short orbital periods are known, WD0137+349B with 116 min period (Maxted et al. 2006; Burleigh et al. 2006) and NLTT5306 with 101.88 min (Steele et al. 2013), and both are not eclipsing. Other WD+BD binaries exist in the variety of cataclysmic variables, but their post-CE evolutionary history was probably different.
The BD nature of the secondary in CSS21055 is suggested by its non-detection in the Bessell I-band during the total eclipse of the WD. At a distance of ~190 pc, the 1-σ limit on the absolute magnitude MI ≳ 16.5 implies a nightside temperature T2 ≲ 1800 K based on the COND models of Baraffe et al. (2003) or T2 ≲ 1980 K for the DUSTY models of Chabrier et al. (2000). For a BD mass of 0.06 M⊙, the radial-velocity amplitude of the WD would be about 40 km s-1. It is possible that the broad absorption lines of the WD contain narrow emission-line cores from the heated face of the secondary. The single available SDSS spectrum is not conclusive in this respect. Our accurate ephemeris will permit to probe the nightside atmosphere of the companion spectroscopically in the 125 s of the total eclipse of the WD, using an 8-m class telescope. If the companion is near the upper mass limit M2 ≃ 0.073 M⊙, the colors of the COND models suggest that it could reach 18.9 mag in K and about 17.5 mag in the warm Spitzer 3.6 μ and 4.5 μ bands. Even at 0.04 M⊙, the apparent brightness of ~20 mag may still allow detection with Spitzer.
A comparison of the observed brightness limit with the predictions of the COND and DUSTY models suggests that the secondary has an age exceeding 1 Gyr, which is larger than the cooling age of the WD of 0.27 ± 0.09 Gyr for a temperature of 13 000 ± 700 K and a mass between 0.5 and 0.6 M⊙. If true, the companion to the WD existed before the CE event. The spectroscopically and geometrically deduced mass argues for a carbon-oxygen WD born on the asymptotic giant branch. Modeling the dispersal of the envelope and the formation of the close binary may present a challenge to CE theory (e.g., Diehl et al. 2008).
Technical note quoted in SDSS DR5, Transformations between SDSS magnitudes and UBVRcIc: http://www.sdss.org/dr5/algorithms/ sdssUBVRITransform.html
Acknowledgments
Most of our data were obtained with the MONET/North telescope of the MOnitoring NEtwork of Telescopes, funded by the Alfried Krupp von Bohlen und Halbach Foundation, Essen, and operated by the Georg-August-Universität Göttingen, the McDonald Observatory of the University of Texas at Austin, and the South African Astronomical Observatory. The “Astronomie & Internet” program of the Foundation and the MONET consortium provide observation time to astronomical projects in high schools worldwide. In addition, this paper uses observations made at the South African Astronomical Observatory (SAAO). We thank the Calar Alto Observatory for the allocation of director’s discretionary time to this programme. Funding for SDSS-III has been provided by the Alfred P. Sloan Foundation, the Participating Institutions, the National Science Foundation, and the US Department of Energy Office of Science. The SDSS-III web site is http://www.sdss3.org. SDSS-III is managed by the Astrophysical Research Consortium for the Participating Institutions of the SDSS-III worldwide Collaboration.
References
- Adelman-McCarthy, J. K., et al. 2012, The SDSS Photometric Catalog, Release 9, VizieR Online Data Catalog [Google Scholar]
- Backhaus, U., Bauer, S., Beuermann, K., et al. 2012, A&A, 538, A84 [NASA ADS] [CrossRef] [EDP Sciences] [Google Scholar]
- Baraffe, I., Chabrier, G., Barman, T. S., Allard, F., & Hauschildt, P. H. 2003, A&A, 402, 701 [NASA ADS] [CrossRef] [EDP Sciences] [Google Scholar]
- Bergeron, P., Wesemael, F., Dufour, P., et al. 2011, ApJ, 737, 28 [NASA ADS] [CrossRef] [EDP Sciences] [Google Scholar]
- Beuermann, K., & Reinsch, K. 2008, A&A, 480, 199 [NASA ADS] [CrossRef] [EDP Sciences] [Google Scholar]
- Beuermann, K., Dreizler, S., & Hessman, F. V. 2013, A&A, 555, A133 [NASA ADS] [CrossRef] [EDP Sciences] [Google Scholar]
- Burleigh, M. R., Hogan, E., Dobbie, P. D., Napiwotzki, R., & Maxted, P. F. L. 2006, MNRAS, 373, L55 [Google Scholar]
- Cardelli, J. A., Clayton, G. C., & Mathis, J. S. 1989, ApJ, 345, 245 [NASA ADS] [CrossRef] [Google Scholar]
- Chabrier, G., Baraffe, I., Allard, F., & Hauschildt, P. 2000, ApJ, 542, 464 [NASA ADS] [CrossRef] [Google Scholar]
- Diehl, S., Fryer, C., & Herwig, F. 2008, in Hydrogen-Deficient Stars, ASP Conf. Ser., 391, 221 [NASA ADS] [Google Scholar]
- Drake, A. J., Beshore, E., Catelan, M., et al. 2010 [arXiv:1009.3048] [Google Scholar]
- Eastman, J., Siverd, R., & Gaudi, B. S. 2010, PASP, 122, 935 [NASA ADS] [CrossRef] [Google Scholar]
- Geier, S., Schaffenroth, V., Drechsel, H., et al. 2011, ApJ, 731, L22 [Google Scholar]
- Gelino, C. R., Marley, M., Stephens, D., Lunine, J., & Freedman, R. 1999, Phys. Chem. Earth part C, 24, 573 [NASA ADS] [Google Scholar]
- Gianninas, A., Strickland, B. D., Kilic, M., & Bergeron, P. 2013, ApJ, 766, 3 [NASA ADS] [CrossRef] [Google Scholar]
- Holberg, J. B., & Bergeron, P. 2006, AJ, 132, 1221 [NASA ADS] [CrossRef] [EDP Sciences] [Google Scholar]
- Kleinman, S. J., Kepler, S. O., Koester, D., et al. 2013, ApJS, 204, 5 [NASA ADS] [CrossRef] [MathSciNet] [Google Scholar]
- Lallement, R., Welsh, B. Y., Vergely, J. L., Crifo, F., & Sfeir, D. 2003, A&A, 411, 447 [EDP Sciences] [Google Scholar]
- Marley, M. S., Gelino, C., Stephens, D., Lunine, J. I., & Freedman, R. 1999, ApJ, 513, 879 [NASA ADS] [CrossRef] [Google Scholar]
- Maxted, P. F. L., Napiwotzki, R., Dobbie, P. D., & Burleigh, M. R. 2006, Nature, 442, 543 [NASA ADS] [CrossRef] [Google Scholar]
- Predehl, P., & Schmitt, J. H. M. M. 1995, A&A, 293, 889 [NASA ADS] [Google Scholar]
- Steele, P. R., Burleigh, M. R., Dobbie, P. D., et al. 2011, MNRAS, 416, 2768 [NASA ADS] [CrossRef] [Google Scholar]
- Steele, P. R., Saglia, R. P., Burleigh, M. R., et al. 2013, MNRAS, 429, 3492 [NASA ADS] [CrossRef] [Google Scholar]
- Sudarsky, D., Burrows, A., & Hubeny, I. 2003, ApJ, 588, 1121 [NASA ADS] [CrossRef] [Google Scholar]
- Tremblay, P.-E., Bergeron, P., & Gianninas, A. 2011, ApJ, 730, 128 [NASA ADS] [CrossRef] [Google Scholar]
All Tables
All Figures
|
Fig. 1 MONET/N white-light and I-band light curves of CSS21055 as a function of orbital phase. Top: eclipse light curve composed of 10 s (yellow) and 20 s (green) exposures. The solid line represents the best-fit model light curve for the model described in Sect. 3.2. Center: unbinned orbital light curve in WL with 20 s exposure times. Bottom: binned light curve in the Bessell I-band. The folded data are displayed for 1.6 orbital periods. |
| In the text | |
|
Fig. 2 I-band image of the field containing CSS 21055 prior to the total eclipse. The image measures 83″ × 83″, north is up and east is to the left. The integrated exposure time is 1200 s. The quoted I-band magnitudes of stars in the image are converted from the Sloan AB magnitudes. The bright star at the bottom is comparison star C2. |
| In the text | |
|
Fig. 3 Same as Fig. 2 for an integrated exposure time of 600 s inside the total eclipse. In both pictures, the circles have a radius of one FWHM of the point spread function. |
| In the text | |
|
Fig. 4 Relation between the best-fit values of a/R1 and R2/R1 for a systematic variation of the inclination i in the light-curve fit (dashed curve). The three crosses (+) indicate the χ2 minimum and the 1-σ error limits. The shaded band represents the region with Δ χ2 < 1. The best-fit WD mass value is noted in red (see text). |
| In the text | |
|
Fig. 5 Mass-radius relation of the secondary in CSS 21055 obtained for the best fit (solid line) and the 1-σ limits (dot-dashed lines). Also shown are the mass-radius relations for the DUSTY models of Chabrier et al. (2000, blue curves) and the COND models of Baraffe et al. (2003, red curves) for ages of 0.5, 1, and 10 Gyr (from top). A secondary with an absolute magnitude MI > 16.5 is located below the respectively color-coded dashed lines. |
| In the text | |
Current usage metrics show cumulative count of Article Views (full-text article views including HTML views, PDF and ePub downloads, according to the available data) and Abstracts Views on Vision4Press platform.
Data correspond to usage on the plateform after 2015. The current usage metrics is available 48-96 hours after online publication and is updated daily on week days.
Initial download of the metrics may take a while.