Free Access
Fig. 4
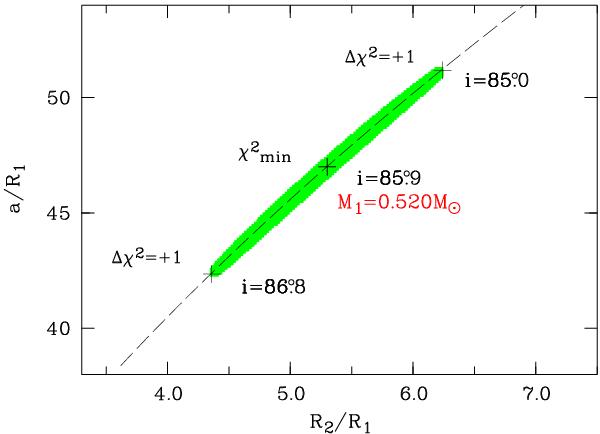
Relation between the best-fit values of a/R1 and R2/R1 for a systematic variation of the inclination i in the light-curve fit (dashed curve). The three crosses (+) indicate the χ2 minimum and the 1-σ error limits. The shaded band represents the region with Δ χ2 < 1. The best-fit WD mass value is noted in red (see text).
Current usage metrics show cumulative count of Article Views (full-text article views including HTML views, PDF and ePub downloads, according to the available data) and Abstracts Views on Vision4Press platform.
Data correspond to usage on the plateform after 2015. The current usage metrics is available 48-96 hours after online publication and is updated daily on week days.
Initial download of the metrics may take a while.