Fig. 4
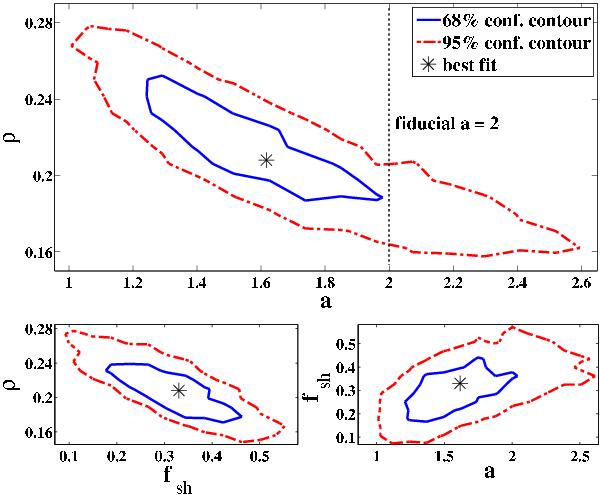
68% and 95% confidence contours from Monte Carlo error analysis for the best-fit parameters ρ, a, and fsh, from the case of shear (iii). The central star shows the MLE of the parameters. We emphasize the a vs. ρ plot since there is a fiducial value for a (=2, vertical dotted line), and ρ has constraints set on it by Jorstad et al. (2005) and Pushkarev et al. (2009).
Current usage metrics show cumulative count of Article Views (full-text article views including HTML views, PDF and ePub downloads, according to the available data) and Abstracts Views on Vision4Press platform.
Data correspond to usage on the plateform after 2015. The current usage metrics is available 48-96 hours after online publication and is updated daily on week days.
Initial download of the metrics may take a while.