Fig. 2
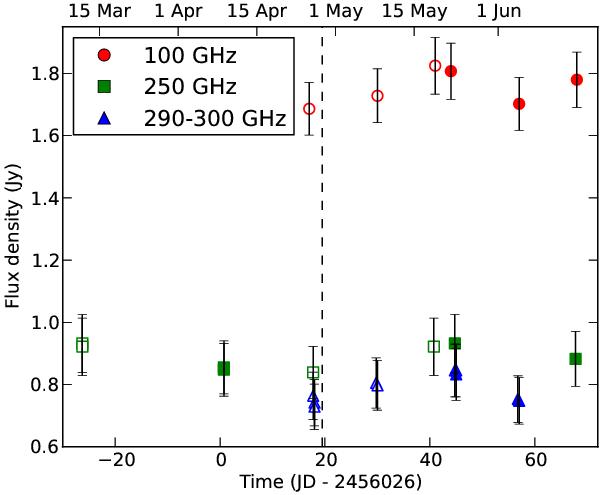
Evolution of the submm flux density of the NE image of the blazar. Filled symbols are the actual flux density measurements of the NE image; empty symbols correspond to the flux densities of the SW image shifted backwards in time by 27 days (i.e., the time delay of the lens, Barnacka et al. 2011) and scaled up according to a quiescent flux ratio of ℜquiet = 1.34 (see Table 2). For each epoch and band, the flux densities of the four ALMA spectral windows (Table 1) were averaged together. The dashed line marks the time when the effect of the ejected plasmon begins to be seen in the NE image, according to our model.
Current usage metrics show cumulative count of Article Views (full-text article views including HTML views, PDF and ePub downloads, according to the available data) and Abstracts Views on Vision4Press platform.
Data correspond to usage on the plateform after 2015. The current usage metrics is available 48-96 hours after online publication and is updated daily on week days.
Initial download of the metrics may take a while.