Fig. 8
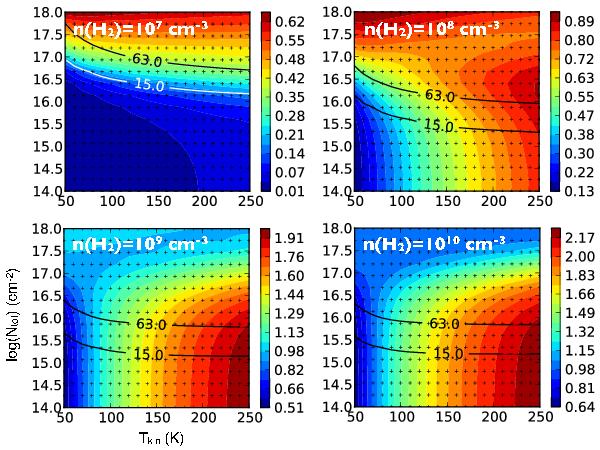
RADEX analysis of the 34SO2 line ratios toward zone A and B assuming a FWHM line width 5.0 km s-1. The intensity ratios 191,19 − 180,18/104,6 − 103,7 are plotted in color scale. The observed integrated intensities of the 191,19 − 180,18 transition are plotted in curves (zone A: ~63 Jy beam-1 km s-1, zone B: ~15 Jy beam-1 km s-1). Toward both zones, the line ratio is about 1.8 (Table 3). Our results suggest that a high H2 volume density (> 109 cm-3) is needed to reproduce the observed line ratios.
Current usage metrics show cumulative count of Article Views (full-text article views including HTML views, PDF and ePub downloads, according to the available data) and Abstracts Views on Vision4Press platform.
Data correspond to usage on the plateform after 2015. The current usage metrics is available 48-96 hours after online publication and is updated daily on week days.
Initial download of the metrics may take a while.