Fig. 7
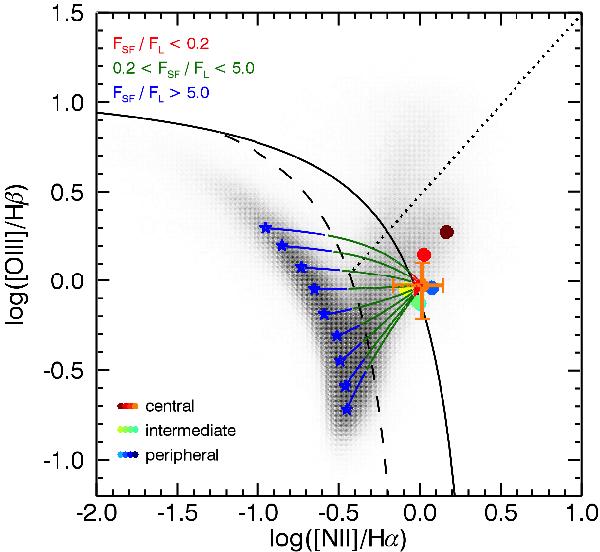
Resulting line ratios if line emission flux purely from SF (blue stars) and purely from a LINER mechanism (orange point) are linearly superposed (coloured lines). The generating Hα flux ratios are colour coded. This shows that the SF contribution in the selected LINER regime right of the solid curve is negligible (FSF/FL < 0.2) and cannot be generating the discrepancy seen in radial emission line profiles with respect to a point-source illumination of >1 dex at larger radii.
Current usage metrics show cumulative count of Article Views (full-text article views including HTML views, PDF and ePub downloads, according to the available data) and Abstracts Views on Vision4Press platform.
Data correspond to usage on the plateform after 2015. The current usage metrics is available 48-96 hours after online publication and is updated daily on week days.
Initial download of the metrics may take a while.