Fig. 5
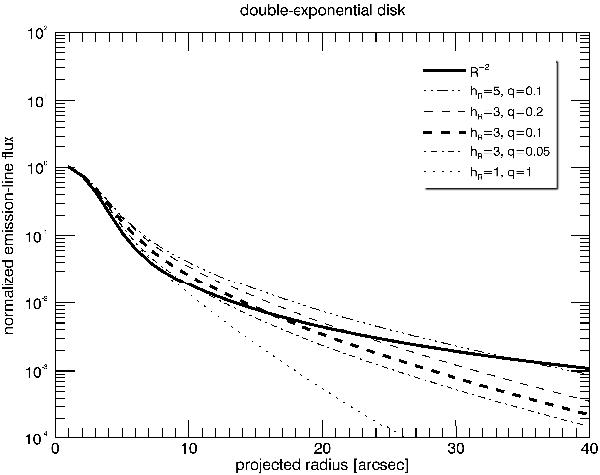
Normalised flux profiles as a function of projected radius R of gas being ionised by a central point source. The thick solid curve assumes that the gas is optically thin and distributed in an infinitesimally thin disk with a constant filling factor and constant density, so that the fall-off is the same inversely squared with radius as the point-source radiation. The thick dashed curve is when the gas is distributed in an axisymmetric disk of finite thickness with gas density both radially and vertically declining exponentially as ∝exp [−R/hR] exp [−| z|/(q hR)] with fiducial values for the scale length of hR = 3 kpc and for the flattening of q = 0.1, viewed at an inclination angle of i = 60°. The thin long/short dashed curves show the effect of a factor of two thicker/thinner disk, the dash-dotted curve is for when the scale length is much larger, and the dotted curve is when the gas distribution is spherical and more centrally concentrated.
Current usage metrics show cumulative count of Article Views (full-text article views including HTML views, PDF and ePub downloads, according to the available data) and Abstracts Views on Vision4Press platform.
Data correspond to usage on the plateform after 2015. The current usage metrics is available 48-96 hours after online publication and is updated daily on week days.
Initial download of the metrics may take a while.