Fig. 2
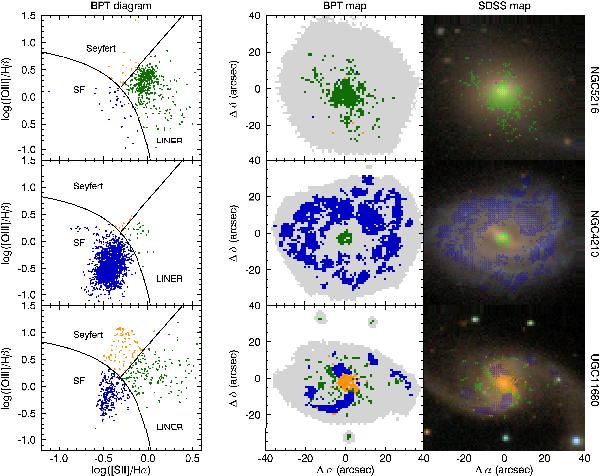
Emission-line-ratio classification of spatial regions. The distribution of measured emission line ratios in a BPT-diagram (left column) and spatially across the galaxy (middle column, usable data regions in grey) differ between example galaxies dominated by LINER-like emission (NGC 5216, top row), a galaxy dominated by star-formation (NGC 4210, middle row) and an AGN in a spiral host (UGC 11680, bottom row). The latter one is shown as an example but not part of our sample. Regions are colour-coded according to their position in the BPT diagram: green for LINER-like, orange for Seyfert-like, and blue for star-formation-like emission line ratios. Overlay of these regions onto the colour-composite image from the SDSS (right column) reveals how LINER-like emission is spatially extended, except when dominated by Seyfert-like emission in the centre or by star-formation-like emission in spiral arms or the disk.
Current usage metrics show cumulative count of Article Views (full-text article views including HTML views, PDF and ePub downloads, according to the available data) and Abstracts Views on Vision4Press platform.
Data correspond to usage on the plateform after 2015. The current usage metrics is available 48-96 hours after online publication and is updated daily on week days.
Initial download of the metrics may take a while.