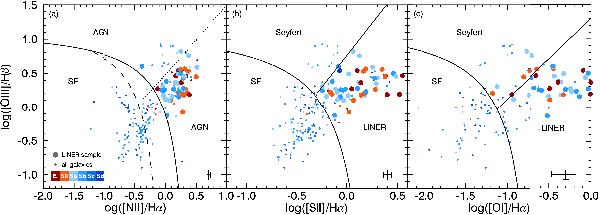
Fig. 1

Selection of LINER galaxies. Data points are coloured by Hubble type and show central emission line ratios of 257 CALIFA galaxies on the BPT diagram. Those classified as AGN in a) and LINER in b) have larger symbol sizes and are selected for further analysis. Small symbol sizes in the LINER region may appear due to either an inconsistent BPT classification, this typically affects points near the demarcation lines, which are either LINERs in b) but not AGN in a), vice versa, or objects that have had the central measurement detect only one of either [NII] or [SII] emission lines. Panel c) is shown for illustration but not used in the classification due to the larger relative error indicated in the lower right corner of each panel. The solid curves are the theoretically modelled “extreme starburst line” (Kewley et al. 2001). The dashed curve (Kauffmann et al. 2003) and the dotted line (Cid Fernandes et al. 2010) in a) and the solid lines (Kewley et al. 2006) in b) and c) are tracing a minimum in the central emission-line-ratio-distribution of SDSS galaxies.
Current usage metrics show cumulative count of Article Views (full-text article views including HTML views, PDF and ePub downloads, according to the available data) and Abstracts Views on Vision4Press platform.
Data correspond to usage on the plateform after 2015. The current usage metrics is available 48-96 hours after online publication and is updated daily on week days.
Initial download of the metrics may take a while.


