Fig. 7
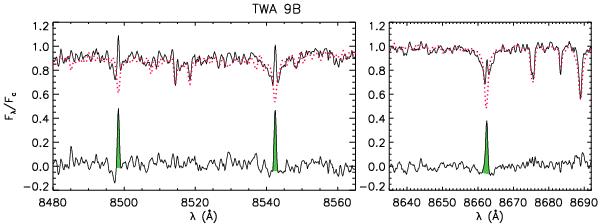
Example of the spectral subtraction procedure. The synthetic inactive template (dotted red line) is overplotted on the observed continuum-normalized spectrum of TWA 9B (solid black line). The differences between observed and template spectra are plotted at the bottom of each box. The hatched areas in the difference spectra represent the excess emissions that have been integrated to obtain the net equivalent widths of the Ca ii IRT lines.
Current usage metrics show cumulative count of Article Views (full-text article views including HTML views, PDF and ePub downloads, according to the available data) and Abstracts Views on Vision4Press platform.
Data correspond to usage on the plateform after 2015. The current usage metrics is available 48-96 hours after online publication and is updated daily on week days.
Initial download of the metrics may take a while.