Fig. 10
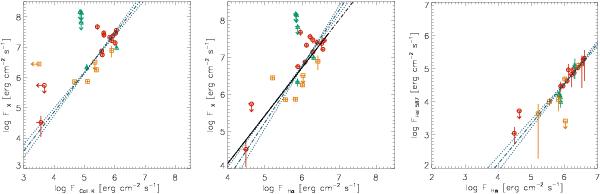
Flux-flux relations for some of the most often used indicators of chromospheric and coronal activity in M stars (Hα, Ca ii K, X-rays and He iλ 5876 Å). Same plotting symbols as in Fig. 4. The results of a linear regression fit to all detections and its standard deviation are shown as dash-dotted and dotted lines, respectively. For FX vs. FHα we also show the relation derived in the same way for a sample of field M dwarfs as solid line (see Stelzer et al. 2012a).
Current usage metrics show cumulative count of Article Views (full-text article views including HTML views, PDF and ePub downloads, according to the available data) and Abstracts Views on Vision4Press platform.
Data correspond to usage on the plateform after 2015. The current usage metrics is available 48-96 hours after online publication and is updated daily on week days.
Initial download of the metrics may take a while.