Fig. 8
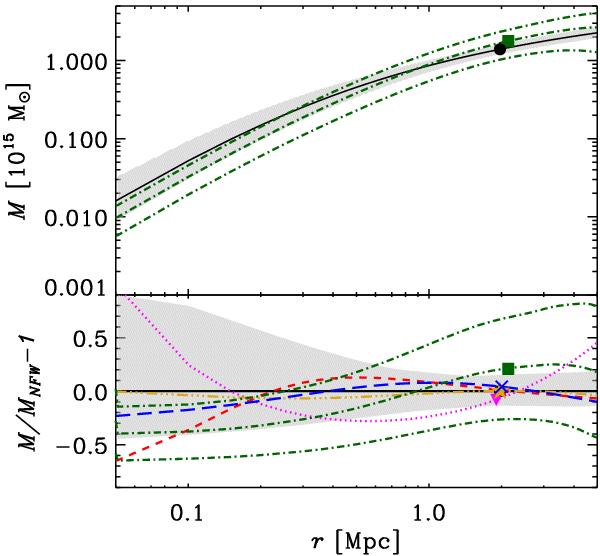
Top panel: mass profiles as obtained from the MAMPOSSt and Caustic analyses. The MAMPOSSt result is that obtained using the NFW model and the O β(r) model, and is represented by a black curve within a grey shaded area (1σ confidence region). The Caustic result is represented by green dash-dotted curves (central value within 1σ confidence region). The black dot and green square represent the locations of the [r200,M200] values for the MAMPOSSt and Caustic M(r). Bottom panel: fractional difference between different mass profiles and the MAMPOSSt best-fit to the NFW M(r) with O β(r) model (displayed in the top panel). The MAMPOSSt best-fit O β(r) Hernquist, Einasto, and Burkert models are represented by the blue long-dashed, gold triple-dot-dashed, and red short-dashed curves, respectively. The MAMPOSSt best-fit C β(r) SIS model is represented by the magenta dotted curve. The Caustic M(r) and 1σ confidence levels are represented by the green dash-dotted curves. The solid line marks the zero and the grey shaded area the 1σ confidence region of the NFW model fit. Symbols represent the location of the [r200,M200/MNFW(r200) − 1] values for the different mass profiles, NFW (filled black dot), Hernquist (blue X), Einasto (gold star), Burkert (red triangle), SIS (magenta inverted triangle), Caustic (green square). The NFW and Burkert values are barely visible in the plot, because they are virtually indistinguishable from the Einasto and Hernquist values. All MAMPOSSt results displayed here are for the rν = 0.63 Mpc value (see Table 2).
Current usage metrics show cumulative count of Article Views (full-text article views including HTML views, PDF and ePub downloads, according to the available data) and Abstracts Views on Vision4Press platform.
Data correspond to usage on the plateform after 2015. The current usage metrics is available 48-96 hours after online publication and is updated daily on week days.
Initial download of the metrics may take a while.