Fig. 12
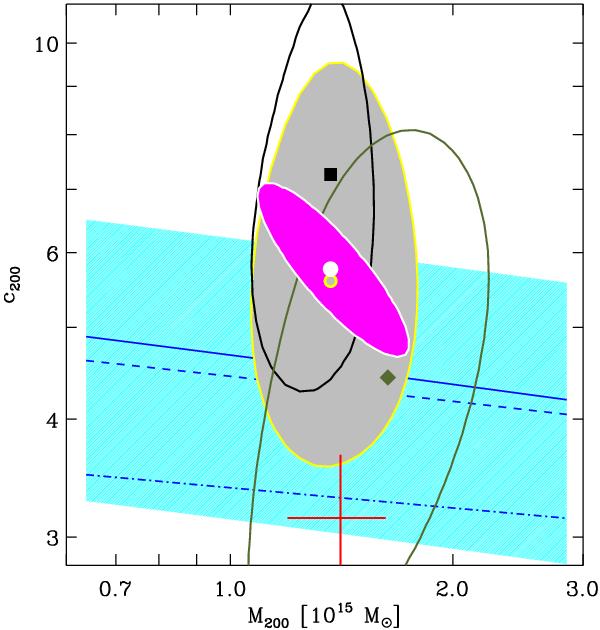
Best-fit solutions and 1σ contours in the M200-c200 space for the NFW M(r) model (see also Table 3). Lensing analysis of U12: small magenta-filled region (with white border) and white filled dot. MAMPOSSt analysis: black vertically-elongated contour and filled square. Caustic analysis: green inclined contour and green diamond. Joint MAMPOSSt + Caustic constraints: gray-filled region and gray dot with yellow borders. Best-fit value and 1σ error bars from the σlos+rν analysis: big red cross. The solid (resp. dashed) blue line and shaded cyan region represent the theoretical cMr of Bhattacharya et al. (2013) for relaxed (resp. all) halos and its 1σ scatter. The dash-dotted blue line represents the theoretical cMr of De Boni et al. (2013) for relaxed halos.
Current usage metrics show cumulative count of Article Views (full-text article views including HTML views, PDF and ePub downloads, according to the available data) and Abstracts Views on Vision4Press platform.
Data correspond to usage on the plateform after 2015. The current usage metrics is available 48-96 hours after online publication and is updated daily on week days.
Initial download of the metrics may take a while.